Journal of Fuzzy Systems and Control, Vol. 4, No 3, 2026 |
Image Processing-Based Morris Water Maze Rat Tracking System: Design and Analysis
Sutrisno Ibrahim 1, *, Gayatri T. R. Dewani 2, Joko Hariyono 3, Faisal Rahutomo 4, Nanang Wiyono 5, Ratih Yudhani 6
1,2,3,4 Department of Electrical Engineering, Faculty of Engineering, Universitas Sebelas Maret, Surakarta, Indonesia
5,6 Department of Medicine, Faculty of Medicine, Universitas Sebelas Maret, Surakarta, Indonesia
Email: 1 sutrisno@staff.uns.ac.id, 2 tarina@student.uns.ac.id, 3 jokohariyono@staff.uns.ac.id, 4 faisal_r@staff.uns.ac.id,
5 nanang.wiyono@staff.uns.ac.id, 6 ratihyudhani@staff.uns.ac.id
*Corresponding Author
Abstract—Four experimental rats consisting of one normal rat and three Alzheimer's-induced rats were analyzed. The proposed system employed ImageJ integrated with the RatsTrack and Macro RatsTrack plugins using a centroid based tracking approach. The system successfully extracted movement trajectories, distance travelled, speed, acceleration, and quadrant dwell time during acquisition and probe trials. The system performance was validated by comparing quadrant dwell times obtained from the proposed system with manual observations. The percentage differences ranged from 2.29% to 70.97%. demonstrating that the proposed system can effectively represent rat behavioral patterns, although discrepancies remain in certain quadrants requiring further refinement.
Keywords—Acquisition Trial; Tracking; Probe Trial; Morris Water Maze
Animal behavior, particularly that of rodents such as rats, has long been a subject of fundamental research in neuroscience and pharmacology. Rats (Rattus norvegicus) are used as models to understand neurological mechanisms, pharmacological responses, and behavioral fundamentals such as anxiety, memory, and exploration.
One of the standard methods used to evaluate cognitive function and spatial memory is the Morris Water Maze (MWM), widely used in neurobehavioral research to test spatial learning and memory in rats [1]. Using the method, rats are placed in a circular water pool with a hidden platform and measured on how quickly and efficiently they find the platform.
Since its development, the Morris Water Maze has been continuously refined in terms of experimental procedures and behavioral assessment, making it one of the most widely used behavioral tests for evaluating spatial learning and memory in rodents. Furthermore, continuous improvements in experimental protocols and behavioral analysis have expanded its application to studies involving healthy animals as well as models of neurological disorders [2], [3].
Since its introduction, the Morris Water Maze has become the gold standard for assessing spatial learning and memory in rodents [4]. MWM has proven to be sensitive in detecting memory impairment caused by neurodegenerative diseases, stress, and pharmacological interventions. Therefore, analysing rat movement in this method will have high scientific value, both for basic research and the development of therapies for brain diseases.
One of the main limitations of the Morris Water Maze (MWM) is that animals may use serial strategies rather than spatial cues to locate the escape platform [5]. It risks producing subjective bias, is time-consuming, and often focuses only on simple parameters such as escape latency, without exploring more complex movement patterns. Escape latency, in the context of the Morris Water Maze, is
the time it takes for an animal model (usually a rat) to find a hidden platform.
In addition to escape latency, the Morris Water Maze allows researchers to analyse swimming trajectories as indicators of navigation strategy [6]. The characteristics of movement paths provide additional behavioral information that cannot be represented by latency alone, allowing
a more comprehensive evaluation of spatial learning performance [7].
In the Morris Water Maze (MWM), acquisition testing trains rats to find a hidden platform, measuring learning through latency (time) and distance to the platform over several days. The subsequent probe trial removes the platform to test spatial memory, assessing how well the animal remembers its location by measuring the time spent in the target quadrant and platform crossings, which indicate integrated long-term memory.
Previous studies have shown that changes in movement trajectories and quadrant exploration patterns are associated with cognitive impairment in rodent models [8]. Therefore, analysing behavioral parameters obtained during acquisition and probe trials provides important information for evaluating spatial learning and memory performance [9].
When conducting animal behavior research using the MWM method, video data quality is a fundamental aspect that determines the accuracy of rat movement analysis, particularly in the process of trajectory detection, object segmentation, and behavior parameter calculation. One important factor that affects the quality of this analysis is the form of the initial data used, namely RAW images.
RAW images are visual data taken directly from the camera without undergoing compression or automatic processing such as colour correction, noise reduction, sharpening, or gamma adjustment. RAW images store complete information on light, texture, and pixel details, making them a much more accurate basis for image processing than compressed video formats such as MP4, AVI, or JPEG.
This has a direct impact on improving the accuracy of measuring important parameters, such as total trajectory, platform search time, duration in each quadrant, and the animal's spatial path pattern. To produce appropriate analyses, image processing methods can be used, such as the commonly used software ImageJ. This open-source software is used to analyse images that can be used to track animal movements [10]. ImageJ has been widely adopted in biological image analysis because it provides various image-processing functions and supports plugin-based workflow development. Its flexibility allows researchers to perform image enhancement, segmentation, measurement, and object tracking within a reproducible analysis pipeline [11].
Several automated tracking systems have been developed to analyze rodent behavior in the Morris Water Maze (MWM). Recent advances include open-source approaches based on computer vision and deep learning, such as the automatic tracking system proposed by Forero et al. [12], DeepLabCut [13], and idtracker.ai [14]. These approaches enable automated and markerless tracking of animal movements while providing objective behavioral analysis with improved accuracy and efficiency.
Despite these advances, several limitations remain. Recent studies have proposed various tracking frameworks to improve the flexibility and accuracy of automated animal behavioral analysis [15]. Therefore, there is still a need for a simple, cost-effective, and reproducible image-processing-based tracking system that can accurately extract behavioral parameters without relying on computationally intensive models.
In this study, a centroid-based tracking approach is implemented using the open-source ImageJ platform integrated with the RatsTrack and Macro RatsTrack plugins to analyze rat behavior in the Morris Water Maze. Unlike studies that primarily emphasize sophisticated deep-learning techniques or commercial behavioral analysis systems, this work focuses on developing an accessible and reproducible image processing pipeline capable of extracting multiple behavioral parameters, including movement trajectories, distance traveled, speed, acceleration, and quadrant dwell time. This approach provides a practical alternative for behavioral neuroscience laboratories seeking a low-cost solution while maintaining objective quantitative analysis.
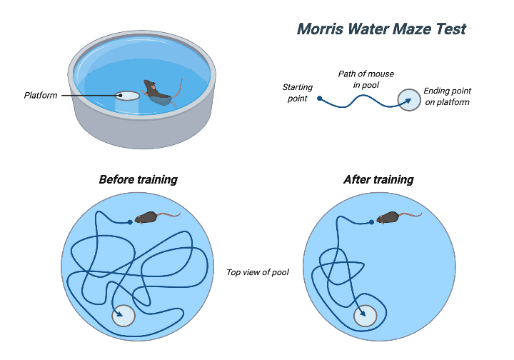
The general configuration of the Morris Water Maze used in this study is illustrated in Fig. 1. The illustration shows the circular water pool, the escape platform, and the division of the pool into four quadrants, which serve as the main spatial references for analyzing rat movement and quadrant dwell time.
In line with the problem formulation, this study aims to obtain rat movement trajectories in the Morris Water Maze test using a centroid-based tracking approach implemented in ImageJ with the RatsTrack and RatsTrack Macro plugins. It also seeks to analyze the characteristics of movement trajectories during acquisition and probe trials based on image processing results. In addition, the study aims to extract and analyze behavioral parameters, including total distance, time distribution in each quadrant, speed, and acceleration, as indicators of learning and spatial memory.
This research is expected to provide benefits by contributing to researchers and academics in the fields of image processing and animal behavior analysis, particularly in applying centroid-based tracking methods to the Morris Water Maze test. It also offers insights into the development of behavioral analysis systems by outlining the stages of image processing and the procedures for tracking rat movement trajectories using ImageJ integrated with the RatsTrack and Macro RatsTrack plugins.
Thus, the results of this study can contribute to behavioral neuroscience research by providing an accessible image-processing-based tool for analysing spatial learning and memory in the Morris Water Maze.
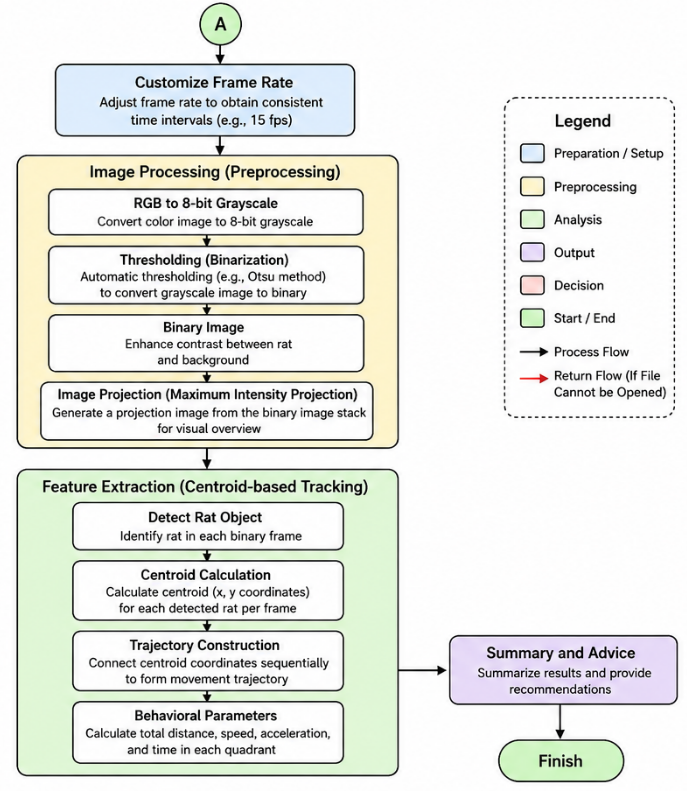
The research methodology consisted of several sequential stages, as illustrated in Fig. 2. The flowchart presents the overall research process, starting from the literature study and raw video preparation, followed by video preprocessing, feature extraction, behavioral parameter analysis, and interpretation of the results. Each stage was conducted sequentially to obtain quantitative information on rat movement during the Morris Water Maze test.
The research methodology consisted of several sequential stages, beginning with a literature study and data preparation, followed by video preprocessing, image segmentation, centroid-based tracking, feature extraction, and behavioral analysis. These stages were performed sequentially to obtain quantitative information on rat movement during the Morris Water Maze test. The details of each stage are described below:
Based on the analysis results, the researchers drew conclusions about the effectiveness of the methods used and the implications of the research results for understanding the spatial behavior of rats. In addition, suggestions were made for further research development, such as the use of more complex deep learning algorithms or system optimisation for real-time analysis.
Imagery from the acquisition trials and probe trials has a similar visual appearance because all videos were recorded using a top view angle with the same camera configuration and arena position. Imagery was captured from above to minimise perspective distortion and facilitate the process of tracking rats during image processing.
During the acquisition trials, the escape platform is not visually visible in the images because it is placed below the water surface and is black in colour, similar to the background of the pool (Fig. 3). Although the platform is not visible in the recorded images, its position is still known in terms of coordinates and is entered as a reference parameter in the tracking system through the use of the ‘with platform’ macro in the RatsTrack plugin. Meanwhile, in probe trials, the escape platform is physically removed from the arena, but the resulting image display remains similar to acquisition trials because the camera and arena configurations are not changed.
In order to provide an initial overview of the raw image arena, there is also a raw data summary Table 1 that presents preliminary information about the video recordings of the Morris Water Maze test before trimming and image processing. This is intended to provide an initial overview of the duration and characteristics of the recordings, which are the main input before tracking.
Subject | Information | MWM trial test | Video duration (before trimming) |
101 | Normal | Acquisition Trial | 00:50 |
102 | 2 injections for Alzheimer's | Acquisition Trial | 02:42 |
113 | 3 injections for Alzheimer's | Acquisition Trial | 02:31 |
115 | Full Alzheimer | Acquisition Trial | 03:54 |
101 | Normal | Probe Trial | 01:12 |
102 | 2 injections for Alzheimer's | Probe Trial | 01:14 |
113 | 3 injections for Alzheimer's | Probe Trial | 01:18 |
During acquisition trials, video duration showed significant variation between subjects. Subject 101 (normal rat) had the shortest video duration, namely 00:50 minutes, reflecting efficient navigation skills in finding the escape platform. Conversely, subjects with Alzheimer's induction treatment showed longer video durations, with subjects 102 and 113 having durations of 02:42 and 02:31 minutes, respectively. Subject 115 (full Alzheimer's) had the longest video duration, namely 03:54 minutes, indicating prolonged exploration before reaching the platform or until the test time limit was reached. The variation in duration was an early indicator of differences in navigation performance and was used to determine the number of frames that had to be processed before tracking using ImageJ software, the RatsTrack plugin, and the RatsTrack macro.
On probe trials, video duration was relatively more uniform compared to acquisition trials, with a time range between 01:12 and 01:31 minutes (exceeding the standard probe trial time of 1 minute) due to the probe trial testing procedure, which generally has a fixed duration and does not depend on the rat's success in finding the platform, because the escape platform is removed.
The video duration data from the Morris Water Maze test underwent trimming before being analysed using an image processing-based tracking system. The trimming process was performed on the raw video to standardise the analysis duration and ensure that the video was suitable for the research objectives by removing unnecessary parts.
The video durations after trimming for each subject and trial are presented in Table 2. The trimming process was performed to remove unnecessary video segments and standardize the duration of the recordings before image processing. For the acquisition trials, the duration was adjusted according to the relevant testing period, whereas all probe trial videos were standardized to 01:00 minute.
As shown in Table 2, the acquisition trial videos of Subjects 102 and 115 experienced the largest reductions in duration after trimming, from 02:42 to 02:25 and from 03:54 to 02:20, respectively. In contrast, Subjects 101 and 113 showed relatively little or no change because their original recordings were already within the appropriate analysis duration. For the probe trials, all videos were standardized to 01:00 minute to ensure a consistent observation period across subjects.
Subject | Information | MWM trial test | Video duration (before trimming) |
101 | Normal | Acquisition Trial | 00:50 |
102 | 2 injections for Alzheimer's | Acquisition Trial | 02:25 |
113 | 3 injections for Alzheimer's | Acquisition Trial | 02:31 |
115 | Full Alzheimer | Acquisition Trial | 02:20 |
101 | Normal | Probe Trial | 01:00 |
102 | Injeksi 2x suntik Alzheimer | Probe Trial | 01:00 |
113 | Injeksi 3x suntik Alzheimer | Probe Trial | 01:00 |
115 | Full Alzheimer | Probe Trial | 01:00 |
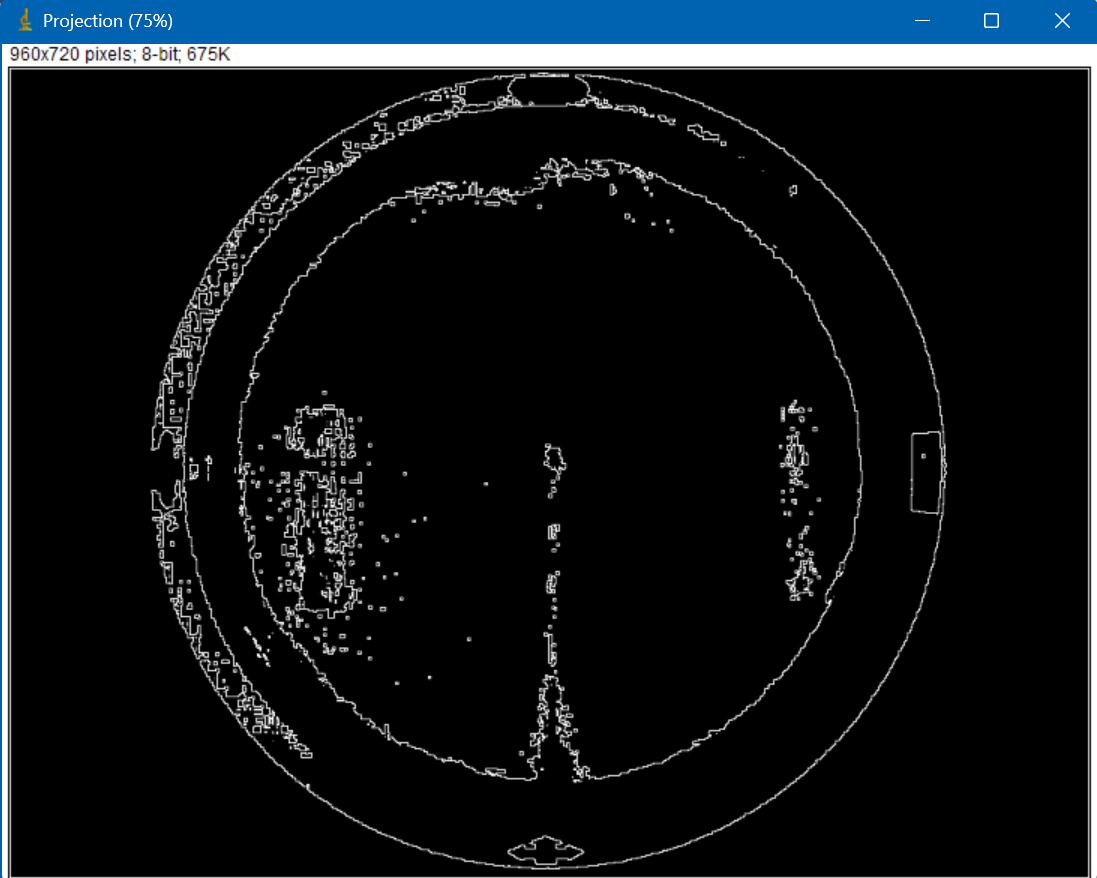
Following the grayscale conversion and projection processes, the tracking results generated by the system were binarized through automatic thresholding. The binary image results in for Subjects 101 and 102 are presented in Fig. 4(a) and Fig. 4(b), while the results for Subjects 113 and 115 are presented in Fig. 4(c) and Fig. 4(d). The binary image exhibited visual noise caused by reflections from the water surface, the pool walls, and the accumulation of pixel intensities across multiple frames.
a | b |
(c) | (d) |
As a result, the segmented image clearly preserved the geometric contour of the MWM pool. In this study, the binary image was not used to detect the mouse but to determine the arena boundary and the pool center for spatial analysis. Therefore, noise in the binary image did not affect the tracking process or the calculation of the predefined parameters. Data from 115 rats were analyzed.
After the pool image was segmented, the Circular Hough Transform was applied to detect the circular boundary of the pool. The algorithm searched for binary pixel patterns that matched the characteristics of a circle within a predefined diameter range, allowing the pool center and radius to be determined automatically. The detected circle was then used as a boundary mask to ensure that object detection was limited to the interior of the pool.
The next stage was foreground segmentation, in which the mouse was separated from the pool background. A fixed threshold (threshold = 20) was applied based on the average intensity of the mouse body under different lighting conditions. Pixels belonging to the mouse were classified as the foreground, while the water surface and pool were classified as the background. The resulting binary image usually contained small amounts of noise caused by water ripples, light reflections, and other visual artifacts. Connected component labeling was then applied to identify all detected objects.
The performance of the proposed tracking system was evaluated using behavioral data obtained from the acquisition and probe trials. The behavioral parameters generated by the proposed system were analysed in each trial to evaluate the effectiveness of the tracking method.
The acquisition trial was conducted to evaluate the learning process of the rats throughout the training sessions. During this phase, the proposed tracking system continuously recorded the rats' movements and automatically extracted behavioral parameters, including escape latency, total distance travelled, swimming speed, acceleration, movement trajectories, and time spent in each quadrant. The tracking results showed that the system consistently detected rat movements from the starting point to the escape platform for all subjects.
Differences in these behavioral parameters enabled the proposed system to distinguish the movement characteristics of normal rats from those of Alzheimer's model rats. These findings indicate that the proposed tracking system was capable of objectively representing differences in spatial learning performance during the acquisition trial.
The distribution of time spent in each quadrant during the acquisition trial is presented in Table 3. The four quadrants (NE, NW, SE, and SW) were analysed to describe the spatial exploration pattern of each subject before reaching the escape platform. Differences in quadrant dwell time provide additional information about how the rats explored the arena during the acquisition trial.
Test Subjects | Time in the NE | Time in the NW | Time in the SE | Time in the SW |
101 | 8.583 s | 5.700 s | 5.167 s | 22.599 s |
102 | 2.802 s | 16.879 s | 4.337 s | 11.609 s |
113 | 36.293 s | 17.747 s | 0.667 s | 7.739 s |
115 | 2.633 s | 3.283 s | 0.900 s | 4.966 s |
In subject 101 (the normal rat), the longest time (more settling and exploring) was recorded in the south-west quadrant, amounting to 22.599s, indicating that the rat's movement path was focused on the area where the escape platform was located. This observation is further supported by Fig. 5, which shows that the rat explored all quadrants before reaching the escape platform. Of all the quadrants, the northeast, northwest, and southeast had a small time difference (approximately 0.5–3 s), while the southeast time distribution and southwest time distribution had a large difference of 17.432s. The rats in this group indicated that they could still explore well and had an instinct for where the escape platform was located.
Subject 102 (2x Alzheimer's induction injection) showed a different time distribution with the largest time in the northwest quadrant at 16.879s. The northeast and southeast time distributions had little time, indicating that the rat only passed through without staying to explore in those two quadrants. Meanwhile, the time distribution in the southwest quadrant was relatively smaller, at 11.609 s. The rat should have spent more time exploring this quadrant, but due to the Alzheimer's disease that had been injected into the subjects' bodies, they experienced spatial memory impairment in exploring with their instincts to find the escape platform.
For subjects 113 and 115, it can be seen how the rats explored the arena in the MWM. In subject 113 (induced by 3x Alzheimer's injections), the time spent in the northeast quadrant was very dominant, and the duration of exploration was 36.293s. The time spent in the northwest quadrant was also quite long, at 17.747 s. Meanwhile, the time spent in the southwest quadrant was very short, only 7.739 s, indicating a disturbance in exploration caused by the subject rats being injected with Alzheimer's disease.
This was not only in the quadrant, but also in the northwest. Subject 115 (full Alzheimer's) showed relatively low times in all quadrants, with the highest value being only 4.966s in the southwestern quadrant. Although the distribution of time was more dominant in the southwestern quadrant, the other quadrants had less time and were more spread out across all quadrants. This indicates that the subject rat had a complete impairment in its spatial memory due to full Alzheimer's disease.
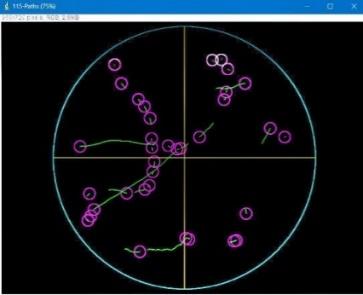
The trajectories shown in Fig. 5 to Fig. 8 are the tracking visualization outputs generated using ImageJ. The purple line indicates the position of the rat's head, while the green line represents the movement trajectory followed by the rat. These trajectory visualizations illustrate the movement patterns obtained from the centroid-based tracking process.
Fig. 5, shows the movement trajectory of Subject 101 (normal rat) during the acquisition trial. The rat explored several quadrants before reaching the escape platform, but its movement gradually became directed toward the target quadrant. Only a few repeated paths were observed, indicating relatively efficient navigation. This movement pattern suggests that the rat was able to use spatial cues to locate the platform and exhibited normal spatial learning ability.
Fig. 6, presents the movement trajectory of Subject 102 following two Alzheimer's inductions. Compared with Subject 101, the trajectory covered a wider area and contained more changes in direction before reaching the escape platform. Repeated exploration was observed in several quadrants, indicating reduced navigation efficiency. Although the rat was still able to reach the platform, the movement pattern suggests an early decline in spatial memory.
Fig. 7, illustrates the movement trajectory of Subject 113. The rat spent a considerable amount of time exploring the northeast quadrant before moving to other areas of the maze. Several overlapping trajectories indicate repeated exploration without a clear navigation strategy. This movement pattern is consistent with impaired spatial learning following repeated Alzheimer's induction.
Fig. 8, shows the movement trajectory of Subject 115 with full Alzheimer's induction. The trajectory was distributed across multiple quadrants with frequent changes in direction and repeated exploration. Unlike the normal rat, no clear tendency to move toward the previous platform location was observed. This pattern suggests severe impairment of spatial memory, resulting in less efficient navigation during the acquisition trial.
Overall, the trajectory patterns demonstrate progressive changes in navigation behavior with increasing Alzheimer's induction. The normal rat exhibited a more efficient movement pattern toward the escape platform, whereas Alzheimer's-induced rats showed increasingly repetitive and less directed exploration. These observations are consistent with the quantitative results presented in Table 3, where Alzheimer's-induced rats generally spent longer periods exploring non-target quadrants before locating the platform.
The trajectory visualizations generated by the ImageJ based centroid tracking system successfully captured differences in navigation behavior among experimental groups, indicating that the proposed image-processing approach was able to represent spatial movement patterns throughout the acquisition trial.
The probe trial was performed after the acquisition phase to evaluate memory retention. In this trial, the platform was removed from the pool, allowing the rats to swim freely while the proposed tracking system analysed their movement trajectories and quadrant exploration. The extracted behavioral parameters were then used to assess spatial memory performance between the experimental groups.
Unlike acquisition trials, probe trials do not have an escape platform as a movement target, so the movement patterns of rats are more exploratory and not directed at a specific point.
The quadrant dwell times obtained from the proposed tracking system during the probe trial are presented in
Table 4. These values describe the distribution of the rats' swimming time across the four quadrants after the escape platform was removed.
Test Subjects | Time in the NE | Time in the NW | Time in the SE | Time in the SW |
101 | 1.201 s | 1.401 s | 6.140 s | 10.877 s |
102 | 1.201 s | 0.334 s | 1.869 s | 19.753 s |
113 | 2.803 s | 4.071 s | 7.007 s | 19.753 s |
115 | 6.605 s | 11.275 s | 2.669 s | 16.346 s |
Based on the results of testing and calculations using the system, it was found that each subject had a different time distribution in each quadrant. All subjects in the south-west quadrant had a dominant time compared to the other quadrants, especially subjects 101 to 115. Subject 101, as a normal rat, produced its time in the southwest quadrant where the escape platform was previously located (in the acquisition trials). For the time distribution variable in each quadrant from the northeast and southeast, there was only a slight difference of 200s, with no significant variation.
However, in the time distribution in the northwest and southeast quadrants, there was a variable change with a difference of 4,740 s. The time difference in the southeast and southwest was only 7,737s, indicating that subject 101 did indeed stay the longest in the southwest quadrant. Meanwhile, although the time in the southwest quadrant appears to be more dominant, there are significant variations between quadrants, starting from the northeast, northwest, and southeast.
In addition to the distribution of time in each quadrant being calculated using software, the manual calculation results for the time spent in each quadrant are presented in Table 5. The manual observation was performed by recording the duration each rat spent in a quadrant based on the first entry of the rat's body, such as the head or tail, into that quadrant.
Test Subjects | Time in the NE | Time in the NW | Time in the SE | Time in the SW |
101 | 5+1 = 6 | 6+6+8 =20 | 3+3+4+7 | 6+4+9+10+12+5+ |
102 | 7+5 = 12s | 14s | 6s | 5+57+10 = 72 s |
113 | 6+3 = 9s | 4+11+9+19+7 = 50s | 3+1+9 = 13s | 10+9+4+19 = 42s |
115 | 14+7+7+9+8 = 45s | 8+7+10+10 | 8+7+10+9 | 9+4+9+1 = 23s |
As can be seen in the table above, all quadrants have different variable variations, and significant changes can also be seen. The rat with subject number 101 explored the south-west quadrant 6 times more because it still remembered the location of the escape platform from the previous test (acquisition trials), indicating that there was no impairment in its spatial memory, even though the difference in the time distribution variables in the south-east and south-west was 43s. The other quadrants had a slight time difference of 14 s (time difference between the northeast and northwest quadrants) and 3s (time difference between the northwest and southeast quadrants).
Subject 102 was seen exploring the southwest quadrant 3 times, and its time distribution was more dominant at 72s, showing that rats with this subject could still remember a little where the escape platform used in the acquisition trials was located, even though they had received 2 injections of Alzheimer's. Subject 113 explored the northwest quadrant and the centroid more often (3 times), as shown in (Fig. 6), which can be seen from the calculation results of the time distribution that was more dominant in that quadrant.
Meanwhile, subject 115 had a more dominant time distribution in the northeast quadrant compared to other quadrants. Subjects 113 and 115's spatial memory was impaired due to the effects of the Alzheimer's disease injection.
To evaluate the accuracy of the manual and software-based tracking systems, a quantitative analysis was conducted by comparing the time in each quadrant obtained from the system (Table 4) and the manual observation results (Table 5).
The percentage differences occurred because the time spent by the rats in each quadrant varied across subjects. The table above shows that the difference in time between the tracking system calculations using software and manual calculations varies in each quadrant. This variation indicates that the distribution of time spent by the rats in each quadrant is not homogeneous.
The percentage differences between the tracking system and manual observations for each subject and quadrant are presented in Table 6. The percentage difference was used to evaluate how closely the automated tracking results corresponded to the manual observations. A lower percentage difference indicates closer agreement between the two methods, whereas a higher percentage difference indicates a larger discrepancy.
As shown in Table 6, the percentage differences varied among subjects and quadrants. The smallest difference was 2.29% for Subject 102 in the northwest quadrant, indicating a relatively close agreement between the automated and manual measurements. In contrast, the largest difference was 70.97% for Subject 115 in the southwest quadrant. These variations indicate that the agreement between the automated and manual measurements was not uniform across all subjects and quadrants.
Subject | % of time in the NE | % of time in the NW | % of time in the SE | % of time in the SW |
101 | 19.917% | 6.905% | 36.018% | 18.028% |
102 | 9.908% | 2.286% | 31.050% | 27.335% |
113 | 31,044% | 8.042% | 53.800% | 46.931% |
115 | 14.578% | 32.114% | 7.750% | 70.970% |
This study demonstrates that rat movement trajectories in the Morris Water Maze test can be effectively obtained using a centroid-based tracking method through image processing with ImageJ, integrated with the RatsTrack and Macro RatsTrack plugins. This approach successfully represents the position of rats in each frame as centroid coordinates, which are then used to construct their movement trajectories.
The results also show that the characteristics of rat movement trajectories differ between acquisition trials and probe trials, indicating variations in behavioral patterns. Furthermore, the extracted behavioral parameters, including total distance, time distribution in each quadrant, speed, and acceleration, demonstrated the potential to characterize differences in learning ability and spatial memory between the experimental rats.
The comparison between the proposed tracking system and manual observation showed percentage differences ranging from 2.29% to 70.97% across the measured quadrants and subjects. These results indicate that the proposed system can represent rat movement and spatial behavior, although differences remain between automated and manual measurements.
This study is limited by the relatively small number of experimental subjects and the absence of inferential statistical analysis. Future work should involve larger sample sizes, statistical validation, and further development of the proposed system toward real-time tracking and integration with more advanced computer vision or deep learning techniques.
This research is funded by the Directorate of Research and Community Service, Directorate General of Research and Development of the Ministry of Higher Education, Science, and Technology with contract number: 112/C3/DT.05.00/PL-MULTITAHUN LANJUTAN/2026 and the research assignment agreement letter number of LPPM UNS: 312.1/UN27.22/PT.01.03/2026. The authors also thank Mr Muhammad Edison for helping gather data.
Sutrisno Ibrahim, Image Processing-Based Morris Water Maze Rat Tracking System: Design and Analysis