Journal of Fuzzy Systems and Control, Vol. 1, No 3, 2023 |
Evaluating the Impact of Cliplimit Parameters and Viewing Distance on Image Clarity in Vein Viewer
Azriel Dutta Akbar Zakawali 1, Erika Loniza 2, Meilia Safitri 3,*, Muhammad Ahmad Baballe 4
1,2,3 Department of Medical Electronics Technology, Universitas Muhammadiyah Yogyakarta, Yogyakarta, Indonesia
4 Department of Mechatronic Engineering, Kano State Polytechnic, Kano State, Nigeria
Email: 1 azriel.dutta.vok21@mail.umy.ac.id, 2 erika@umy.ac.id, 3 meilia.safitri@vokasi.umy.ac.id,
4 mbaballe@kanopoly.edu.ng
*Corresponding Author
Abstract—Detection of veins is a critical aspect of intravenous catheterization, but it is a challenging task prone to errors, which can lead to complications such as discomfort or vessel damage. To address this issue, Vein Viewer, an auxiliary tool that employs an infrared camera, has been used to enhance vein visibility. This device captures a subcutaneous venous map using an infrared camera and then processes the images using a Raspberry Pi to display them in real-time on an LCD. This study aims to improve the use of Vein Viewer by analyzing its performance in relation to cliplimit adjustments and varying distances from the skin surface. Our findings indicate that the clearest images are obtained with cliplimits of 500 at 10 cm, 300 at 20 cm, and 400 at 30 cm. These results provide valuable insights into the optimal use of Vein Viewer and offer a practical approach to improve the accuracy of vein detection and reduce the rate of intravenous catheterization errors, ultimately enhancing patient care.
Keywords—Vein Viewer; Catheterization; Image Filtering; Clip Limit
The circulatory system is the primary physiological system in the human body that is responsible for the transportation of nutrients and oxygen to all parts of the body. The circulatory system transports blood throughout the body via two distinct blood vessels: arteries and veins. Veins serve as conduits for healthcare practitioners to perform procedures such as vaccination or drug administration, as they facilitate the distribution of blood throughout the body. For efficient drug delivery, the most rapid method is administering the medicine through intravenous injection, enabling the substance to disseminate swiftly throughout the bloodstream [1]. Healthcare professionals consider the patient's age a determining factor when selecting a vein. Adult individuals commonly utilize veins in their upper extremities, while young individuals rely on veins in their cranial and lower extremities [2].
Hand vein biometrics is an emerging technology that is used to detect the unique patterns of veins in the individual's hand. It offers greater benefits compared to the current biometrics. The hand vein comprises the veins in the forearm, wrist, palm, fingers, and anterior regions. The suggested study utilizes the characteristics of the dorsal palm vein [3]. Veins are blood channels responsible for transporting deoxygenated blood back to the heart [4]. Intravenous detection is utilized to locate these veins in preparation for administering fluids or medications via the intravenous route. However, the process of locating veins is not devoid of challenges, sometimes resulting in unsuccessful infusion placement, especially in those with dark complexion, deeply situated veins, the elderly, infants, and those with a greater body size. Patients who have veins that are challenging to locate are categorized as having Difficult Venous Access (DVA). Malfunctions in the insertion of intravenous catheters can result in significant distress, injury, and potentially even the bursting of blood vessels. Optimal needle positioning within the vein is necessary to improve patient comfort [5].
The Vein Viewer has been developed as a technological aid to improve the detection of veins, especially those that are not visibly prominent. Utilizing infrared (IR) light, which is absorbed by deoxygenated blood, the Vein Viewer illuminates the skin, captures the reflected light from surrounding tissues via an infrared camera, and processes the image through a Raspberry Pi. The processed image is then displayed on the device, allowing for enhanced visibility of the veins [6]. Previous research [5] indicated limitations in using RGB LED wavelengths for this purpose, leading to indistinct results. Consequently, the current study builds upon prior work by employing an infrared camera and digital filters, including grayscale, threshold, Clahe, histogram, and Gaussian blur, to generate better image clarity. Additionally, the study explores optimizing the Cliplimit value in the filter and the variation of image capture distances to produce superior imaging results.
To obtain images that are appropriate for immediate presentation and the identification of veins, it is imperative to optimize the distance, contrast, and filter configurations. Integrating several filters and upgrades into the infrared module, achieved by adding crucial components, has played a pivotal role in enhancing imaging results.
Despite advancements in medical imaging, the field still needs to work on precisely identifying and depicting veins for intravenous catheterization. This research aims to maximize the utilization of the Vein Viewer, a device specifically developed to improve the viewing of venous vessels. This will be achieved by determining the most efficient Cliplimit settings and observation distances. This work aims to fill the existing research void by systematically evaluating the impact of different distances from the skin surface (10 cm, 20 cm, and 30 cm) and changing the Cliplimit values (ranging from 100 to 999) on image quality.
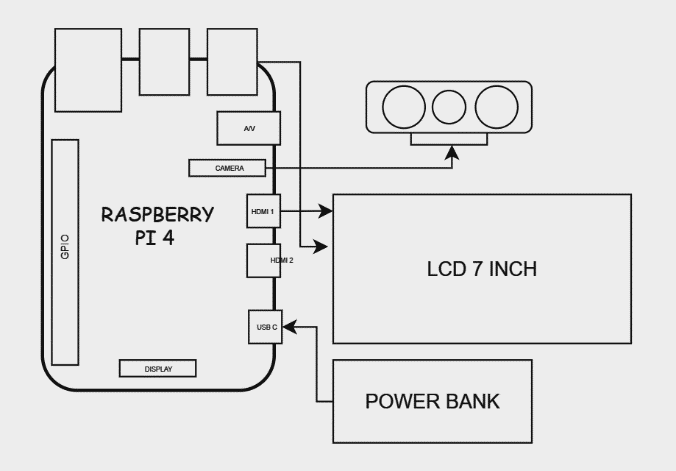
The hardware configuration utilizes a Raspberry Pi 4B microcomputer with 8GB RAM to serve as an image manager for the photographs taken by the Raspberry IR camera. The primary power supply is a 5VDC Li-ION battery with a power output of 20,000mAh. The Raspberry infrared camera is equipped with a 5-megapixel resolution and employs a 330Ω resistor to decrease the intensity of infrared light. The Raspberry Pi utilizes a 7-inch TFT LCD screen to exhibit real-time processed, filtered photographs. Fig. 1 illustrates the essential operations of the system.
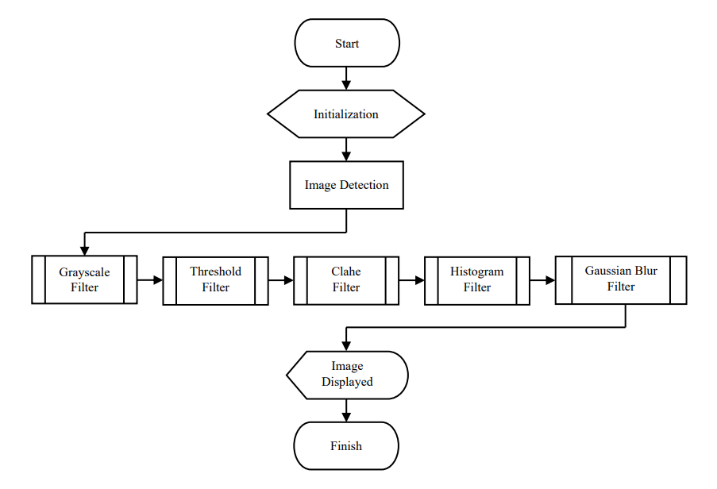
The image processing commands are executed utilizing the Linux operating system and the Python programming language in conjunction with the computer vision library OpenCV. The filters are implemented using the Python programming language, while the viewer and Raspberry Pi 4 Model B board are managed through a laptop running the VNC Viewer software. The flowchart depicting the Vein Viewer filter is presented in Fig. 2.
Upon activation of the gadget, the automated system initiates the program, and the camera captures photographs. The captured photographs will be filtered digitally and shown in real-time on the LCD screen. The employed filters encompass:
These filters transform the reddish-purple images captured by the Raspberry Pi infrared camera into a grayscale or black-and-white effect, sometimes known as monochrome [7]. This method is designed to transform widely used colors into grayscale. When dealing with colorful photographs, our primary objective is to enhance image quality by locally transforming the background into a consistent image, thereby simplifying it. These criteria significantly influence the readability of the images utilized to develop this vein viewer device [8]. The code implementation for the grayscale filter is depicted in Fig. 3.
Threshold-based segmentation encompasses two separate concerns: binary thresholding and multilayer thresholding. Bi-level thresholding involves dividing an image into two distinct classes, such as distinguishing objects of interest from the background. On the other hand, multi-level thresholding involves dividing the image into more than two classes. Individual classes delineate the degrees of pixel intensity contained within two adjacent thresholds. Moreover, thresholding procedures can be categorized as either parametric or nonparametric. Parametric approaches need to determine statistical parameters to describe the distribution of each class. Nonparametric approaches, however, eliminate the need for modeling class distributions and instead focus on determining threshold values using different objective functions [9]. Computers must employ completely automated thresholding to decide the threshold independently. Thresholding strategies are categorized into six groups based on the type of information that the algorithm manipulates. One of the methods is binary thresholding [10]. The code implementation for the grayscale filter is depicted in Fig. 4.
Contrast Limited AHE (CLAHE) mitigates the problem of excessive noise amplification resulting from conventional AHE. The CLAHE approach partitions the input image into non-overlapping smaller portions of approximately equal size. Subsequently, histograms are employed to equalize each partitioned region [11]. The Cliplimit value in CLAHE can be adjusted within the range of 0 to 999 [12]. The code program for the grayscale filter is illustrated in Fig. 5.
Histogram equalization (HE) is an image pre-processing technique that falls under the area of brightness corrections. The High Efficiency (HE) technique is extensively employed to enhance the quality of images. HE, or histogram equalization, is commonly used in various domains such as medical imaging, scientific photography, historical documentation, and sonar imaging. HE is employed to enhance the contrast in digital images [13]. The code implementation for the grayscale filter is illustrated in Fig. 6.
Image processing uses Gaussian blur to achieve a blurred effect on photographs. Accurate assessment of blur is essential for blind picture deconvolution. This study utilizes the Gaussian kernel [14]. In this study, the Gaussian blur filter is employed to eliminate noise from the images, as blurring results from image smoothing. Additionally, it is employed as a preliminary procedure in computer vision to enhance the structure of the image. Mathematically, applying Gaussian blur to a photograph can be described as convolving it with a Gaussian function. Gaussian blur is an image-blurring technique that applies a Gaussian function based on the normal distribution to every pixel in the image. The equation representing the Gaussian function in one dimension is provided in the following equation [15]. The signal-to-noise ratio (SNR) is a metric utilized to quantify the noise level present in an image [16]. The code implementation for the grayscale filter is shown in Fig. 7.
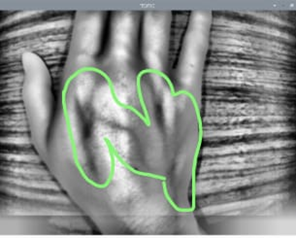
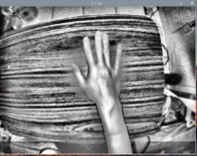
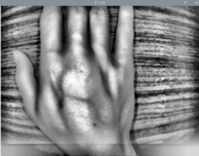
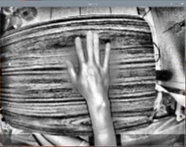
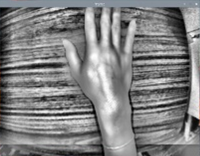
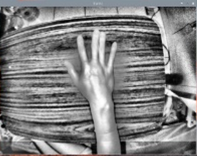
An experiment was conducted to establish the relationship between the Cliplimit settings and viewing distance in resulting image quality. Thirty measurements were recorded, with ten trials conducted at distances of 10 cm, 20 cm, and 30 cm. The Cliplimit values ranged from 100 to 999, increasing in increments of 100. In order to locate the venous blood vessels in Fig. 8, one should observe that the venous blood vessels will exhibit a darker appearance compared to the surrounding tissue.
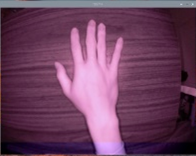
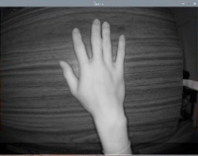
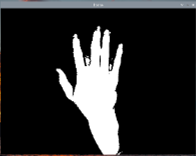
Based on the provided chart, Table 1, image point 1 represents the initial image captured by the infrared camera. This image has a purplish hue as a result of the infrared radiation. Image point 2 is obtained by implementing a grayscale filter, resulting in a monochromatic appearance with varying shades of gray. Image point 3 is the outcome of using grayscale and threshold filters to get a binary image with black and white hues. Image point 4 combines grayscale, threshold, and histogram filters. This view displays venous blood vessels, yet a significant amount of noise is also present. The noise will undergo a Gaussian blur filter to achieve a smoother image, as demonstrated in image point 5. Comparison of image quality with different cliplimit and distance is shown in Table 2.
Number | Image Results | ||
Results | Filter | Distance | |
1 | Original Image | 20 cm | |
2 | Grayscale | 20 cm | |
3 | Threshold | 20 cm | |
4 | Histogram | 20 cm | |
5 | Gaussian Blur | 20 cm | |
Number | Clahe filter with Cliplimit setting | ||
Results | Cliplimit | Distance | |
1 | 100 | 10 cm | |
2 | 100 | 20 cm | |
3 | 100 | 30 cm | |
4 | 200 | 10 cm | |
5 | 200 | 20 cm | |
6 | 200 | 30 cm | |
7 | 300 | 10 cm | |
8 | 300 | 20 cm | |
9 | 300 | 30 cm | |
10 | 400 | 10 cm | |
11 | 400 | 20 cm | |
12 | 400 | 30 cm | |
13 | 500 | 10 cm | |
14 | 500 | 20 cm | |
15 | 500 | 30 cm | |
16 | 600 | 10 cm | |
17 | 600 | 20 cm | |
18 | 600 | 30 cm | |
19 | 700 | 10 cm | |
20 | 700 | 20 cm | |
21 | 700 | 30 cm | |
22 | 800 | 10 cm | |
23 | 800 | 20 cm | |
24 | 800 | 30 cm | |
25 | 900 | 10 cm | |
26 | 900 | 20 cm | |
27 | 900 | 30 cm | |
28 | 999 | 10 cm | |
29 | 999 | 20 cm | |
20 | 999 | 30 cm | |
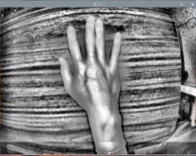
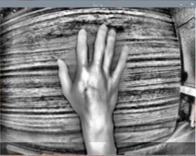
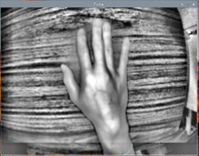
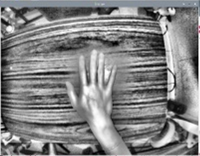
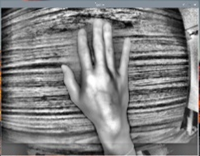
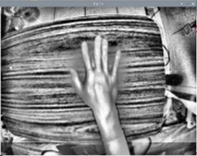
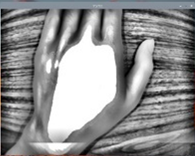
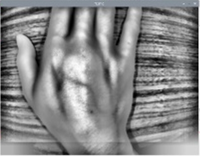
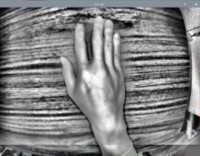
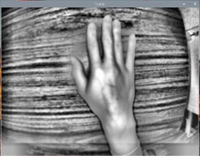
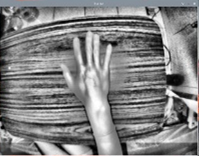
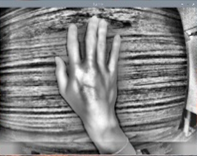
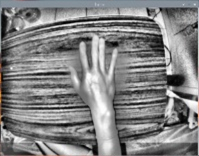
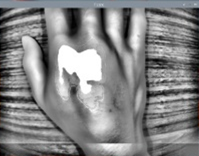
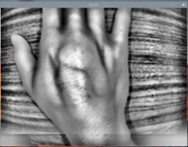
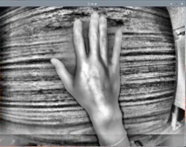
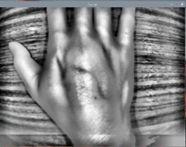
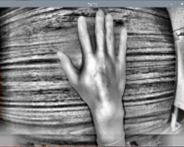
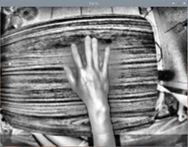
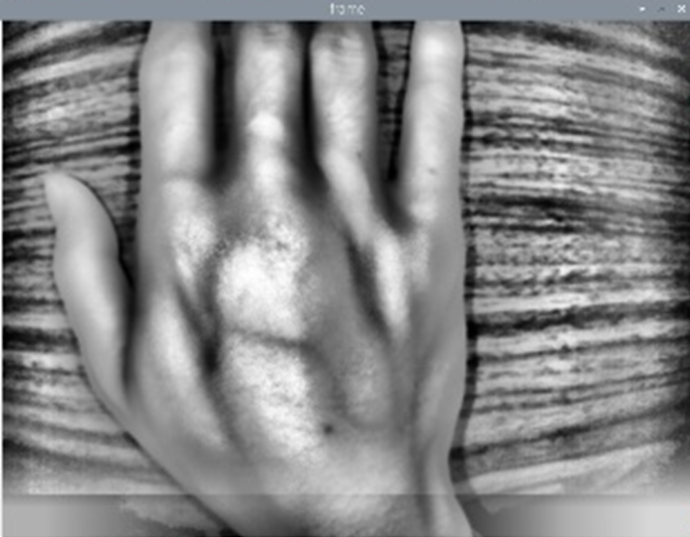
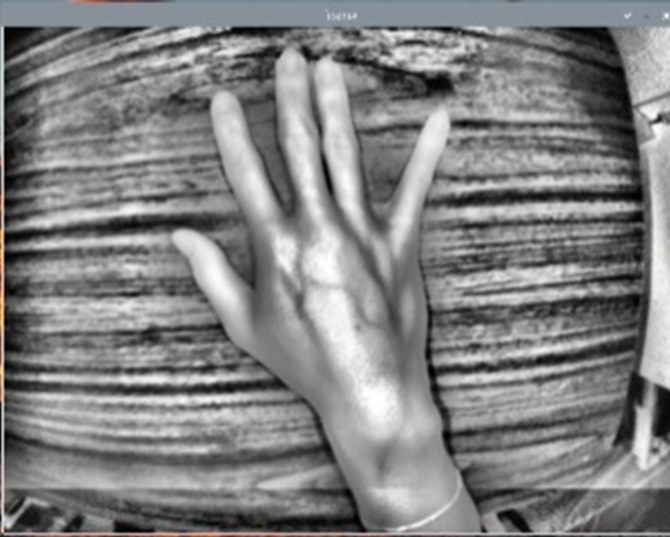
During this testing scenario, venous blood vessels can be identified up to a distance of 10 cm, regardless of the Cliplimit settings. The Cliplimit values that yield visually pleasing photographs of recognized venous blood veins for a 10 cm distance are 400, 500, and 600. The highest image quality is achieved when using a Cliplimit value of 500. The observation can be made in Fig. 9. At a distance of 20 cm, venous blood vessels are visible at all Cliplimit values, but the highest image quality is achieved at a cliplimit of 300. Fig. 10 displays the observed phenomenon.
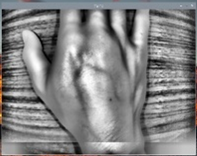
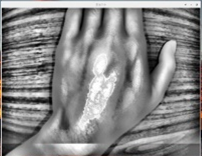
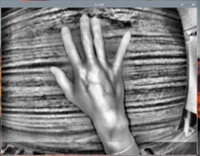
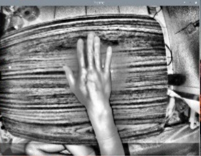
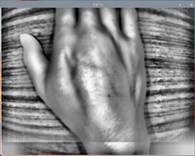
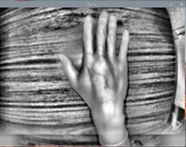
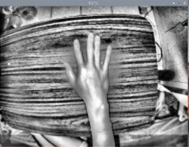
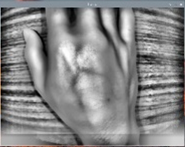
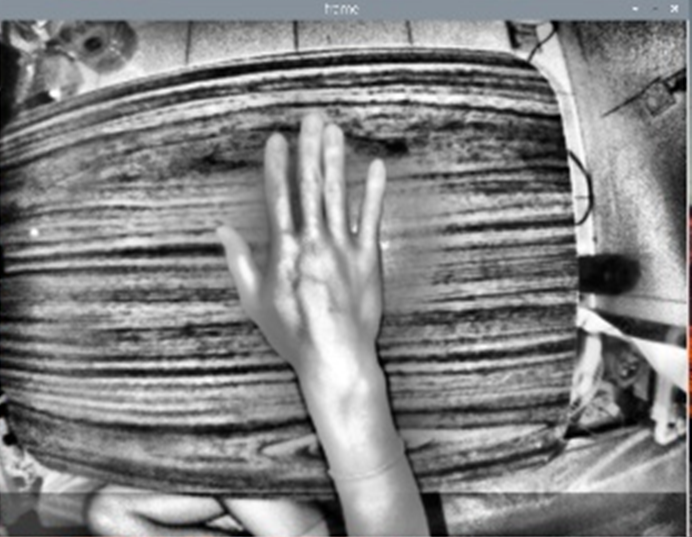
Veins can be observed up to a viewing distance of 30 cm with any Cliplimit setting. Nevertheless, when specific cliplimit settings are used, the blood vessels' appearance diminishes. High-quality images are obtained using the Cliplimit values of 400, 500, and 600, with 400 yielding the most optimal outcomes. The observation can be made in Fig. 11.
The collective outcome of the several Cliplimit configurations demonstrates that the optimal image is produced using a cliplimit value of 300 at a distance of 20 cm. At this specific value and distance, venous blood vessels efficiently absorb infrared light, resulting in a darker appearance than deoxygenated blood vessels and the tissues around them.
This research aims to maximize the utilization of the Vein Viewer, an advanced technology designed to improve the viewing of veins. The study intends to enhance the device's effectiveness in clinical situations by determining the most effective settings for the Cliplimit parameter and the ideal observation distances. The empirical data suggests that the Cliplimit setting is crucial in attaining the highest image quality at different viewing distances. A setting of 500 Cliplimit value is considered perfect for a 10 cm viewing distance; 300 is optimal at 20 cm, and 400 is considered most acceptable at 30 cm. These findings emphasize the need to adjust the Cliplimit setting based on the viewing distance from the target area.
Azriel Dutta Akbar Zakawali, Evaluating the Impact of Cliplimit Parameters and Viewing Distance on Image Clarity in Vein Viewer