Journal of Fuzzy Systems and Control, Vol. 1, No 1, 2023 |
|
DC Motor Speed Control with Proportional Integral Derivative (PID) Control on the Prototype of a Mini-Submarine
Qolil Ariyansyah 1, Alfian Ma’arif 2*
1, 2 Department of Electrical Engineering, Universitas Ahmad Dahlan, Yogyakarta, Indonesia
1 qolil1800022062@webmail.uad.ac.id, 2 alfian.maarif@te.uad.ac.id
*Corresponding Author
Abstract— DC (Direct Current) motors are widely used as controllers in the industrial and robotics fields. In the rotation of the DC motor, there is still an unstable rotational speed so that a controller is needed to be able to stabilize the speed at the rotation of the DC motor. The control used in this study used the PID (Proportional Integral Derivative) control method. The PID control system works by processing calculations based on control variables  ,
,  , and
, and  to achieve conditions according to the expected setpoints. To achieve the expected conditions, the trial and error method is used. PID control in this study was implemented on a DC motor with a brushed type using an Arduino Mega microcontroller. The speed of the DC motor is read by the encoder sensor and entered in the PID equation. The output of the PID value will produce data in the form of PWM (Pulse Width Modulation) which will be the input of the L298N driver via Arduino Mega. The DC motor will produce a rotational speed in the form of RPM (Revolution Per Minute) data up to the specified set point. The implementation of PID was produced by giving parameter values to
  , and . The best PID parameter usage in this study was in the form of = 0.6; =0.3; and =0.01. The application of the PID parameter obtains a stable system response curve at a predetermined set point. The resulting ,
  and parameter data is used as graph data in MATLAB software.
Keywords—Robot; PID; PWM; DC Motor
Introduction
The PID (Proportional Integral Derivative) controller is a conventional controller that is still widely used in the industrial world compared to more modern types of controls [1]. The linear squared regulator and predictive control model used for optimal control of DC motor speed were studied by Sahoo. In DC motor models, different control techniques are used to control the speed angle [2]. The technique of obtaining good precision angular position control of DC motors is directed using PID controllers. The implementation code is considered to produce PWM output using the PID (Proportional Integral Derivative) tuning algorithm. According to the PID tuning method, the error is not only solved but also brought to its minimum value by a very low number of error oscillations [3]. The Proportional Integral Derivative (PID) controller is one of the classic controllers popular in various applications. One of the challenges of the PID controller is to obtain optimal values from proportional, integral and derivative parameters [4]. PID (Proportional Integral Derivative) controllers have a wide range of applications, such as power generation, chemical processing, automated control, and industrial processes, although many other controllers are available. The demand for a PID controller arises from its simple but effective structure. However, the effectiveness of the PID controller depends on adjusting its parameters [5]. There are several PID tuning methods, including the Ziegler-Nichols method and the Fuzzy method. Most of these tuning methods require extensive knowledge of the control system. So there is a need for alternative tuning automation and practitioners who do not need in-depth control system knowledge [6]. The equation of output values in the PID control system can be formulated:
| 
| (1) |
Equation (1) explains that the output value of  is the sum of proportional gain (), integral gain () and gain derivative () which are affected by a certain error (
 ) and time (
 ) respectively. However, the uncertainty that exists, is nonlinear, and manually tuned parameters of a typical PI, PD, or PID controller make it difficult to determine the appropriate gain to achieve optimal performance of the system [7]. The PID controller has only three parameters, but it is not easy to find accurate values to achieve system stability. There are common trade-offs between the durability and performance of control systems [8].
The PID controller is responsible for correcting the error it receives from the difference between the input signal and the tachometer output signal, the corrected error enters the amplification stage before entering the plant [9]. The control parameters are set to achieve a stable closed-loop response of the system and reach the desired position within a certain time [10]. The proportional controller speeds up the ride time and increases the overshoot. The integral controller eliminates the fault of the stuck state and increases the overshoot. The derived control slightly reduces the overshoot. Overshoot is not a top priority setting for autonomous platform performance. But, what is used is the turnaround time and the resulting error [11].
DC motors are considered adjustable speed machines. The speed of the DC motor can be controlled over a wide range through proper adjustment of the terminal voltage proportional [12]. One method that is often used for controlling DC motors using microcontrollers is the Pulse Width Modulation (PWM) method. The speed of the electric motor depends on the modulator voltage. The greater the voltage, the faster the rotation of the electric motor [13]. When applying the PWM control method, keep in mind that using a DC motor as a low pass system. The PWM method is to avoid high frequencies and we know that large motors are mainly inductive so avoiding high frequencies, then it will not work well using high frequencies. This method works at low frequencies so lower frequencies are better than higher frequencies [14]. Early conventional approaches were used for PID controllers to control motor rotation for purposes requiring low accuracy such as trial and error and MATLAB tuner applications [15].
Method
Research Instruments
The instruments in this study used an electronic system consisting of an encoder sensor, a DC motor driver, and an Arduino Mega microcontroller. While the actuator of the robot consists of a DC motor as the drive, and the robot driver, here is the explanation:
- Arduino Mega
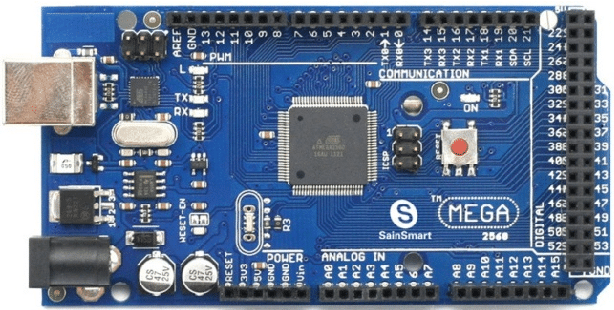
Arduino Mega 2560 is a microcontroller development board based on Arduino using the ATmega2560 chip. This board has quite a lot of I/O pins, a total of 54 digital I/O pins (15 pins of which are PWM), 16 analog input pins, 4 UART pins (serial port hardware). Arduino Mega 2560 show in Fig. 1.
- Arduino Mega
This microcontroller communicates serially by using a USB cable used specifically on the Arduino port to send programs from the Arduino IDE software.
- L298N Driver
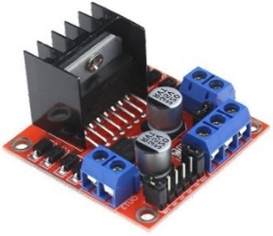
The rotation of the DC motor is controlled by using a microcontroller, but the current coming out of the microcontroller is very small to run the motor so an external circuit capable of running the motor is needed. Therefore the L298N IC is used as a driver circuit to run the motor based on the commands of the microcontroller [16]. L298N Driver show in Fig. 2.
- L298N Driver
The module consists of an L298 motor driver IC and a 78M05 5V regulator. The L298N module can control up to 4 DC motors, or 2 DC motors with direction and speed control [17].
- Encoder Sensor
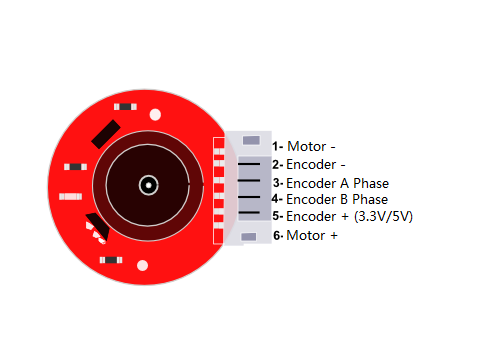
A speed sensor (Rotary Encoder) is mounted on the roller belt to obtain accurate read speed. This sensor will transmit data on each PWM increase to accurately measure speed and control speed at the same time, based on set points. Encoder sensor show in Fig. 3.
- Encoder sensor
The mechanism is carried out a large measurement of RPM (Rotation Per Minute) from the propeller. To determine the performance of the rotary encoder, the rotary encoder was tested using an electric motor with variations in the input voltage and the rpm value of the rotary encoder was tested by measurement using a Tachometer [18].
- DC Motor
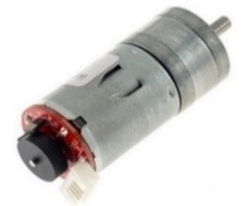
A DC Electric Motor or DC motor is a device that converts electrical energy into kinetic or motion energy. Generally speaking, the torque generated by a DC motor is proportional to the anchor current and magnetic field strength [19]. DC Motor show in Fig. 4.


- DC Motors
DC motors are generally used in the linear range of the magnetization curve. Therefore, the air gap flux is proportional to the field current. The torque developed by the motor is proportional to the anchor current and air gap flux [20].
Block Diagram System
The system block diagram in the design of the mini-submarine system is used as an initial design such as the components used, system inputs and outputs, and the system work process in sequence. The block diagram system can be seen in Fig. 5.
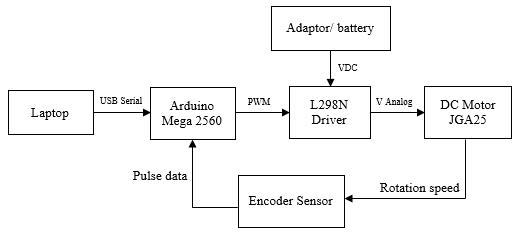
- Block diagram system
Based on Fig. 5, Arduino Mega is implemented as a microcontroller module to control and process data from input devices and then forward it to the output tool. The speed of the DC motor will be read by the encoder sensor and entered into the PID equation. The output of the PID value will produce data in the form of PWM (Pulse Width Modulation) which will be the input of the L298N driver via Arduino Mega. DC motors will produce angular velocities in the form of RPM data up to the specified set point. The RPM data on the serial monitor will be converted into a system response graph in the MATLAB software.
PID Control Block Diagram
PID control block diagram used to provide an overview of the input and output functions of the system. The PID controller consists of 3 elements, namely proportional parameters, integral parameters, and derivative parameters, all three of which are connected in parallel. All of them take error data as input. , , and  are gains from parameters P, I, and D respectively [21]. Refers to the system response time domain with the calculation of error values. The P value refers to the current error, the I value refers to the previous accumulation of error and the D value based on the prediction of the error afterwards. The resulting error is given to the controller that gives the control signal as input to the PWM module to drive the DC motor [22]. Then, the output of the PID control is calculated by summing the results of the values P, I, and D multiplied by their respective errors.
This research will be used to search for the controlling constant experimentally (trial and error). The PID control block diagram can be seen in Fig. 6.

- PID control block diagram
PID Control Flow Chart
The microcontroller system initializes the  (set point) program to determine the value of the parameters , , , . The speed sensor (encoder) will read the speed of the motor which will then be reversed. Then there is a comparison between the read speed and the set point value, the comparison will produce an error value.
The result of the error value is used as the calculation of the PID control signal equation. The output of the equation will produce the PWM duty cycle value of the DC motor. If there is an error data or more than 0, it will produce a duty cycle value, the greater the error that occurs, the greater the duty cycle generated. The duty cycle on the PWM exit of the DC motor will produce output pulses from the PID controller which is used to divert the transistor on the DC motor driver. DC motors with PID control method can stabilize the system's response to changes in the input signal (set point) and minimize errors. The PID control flow chart can be seen in Fig. 7.
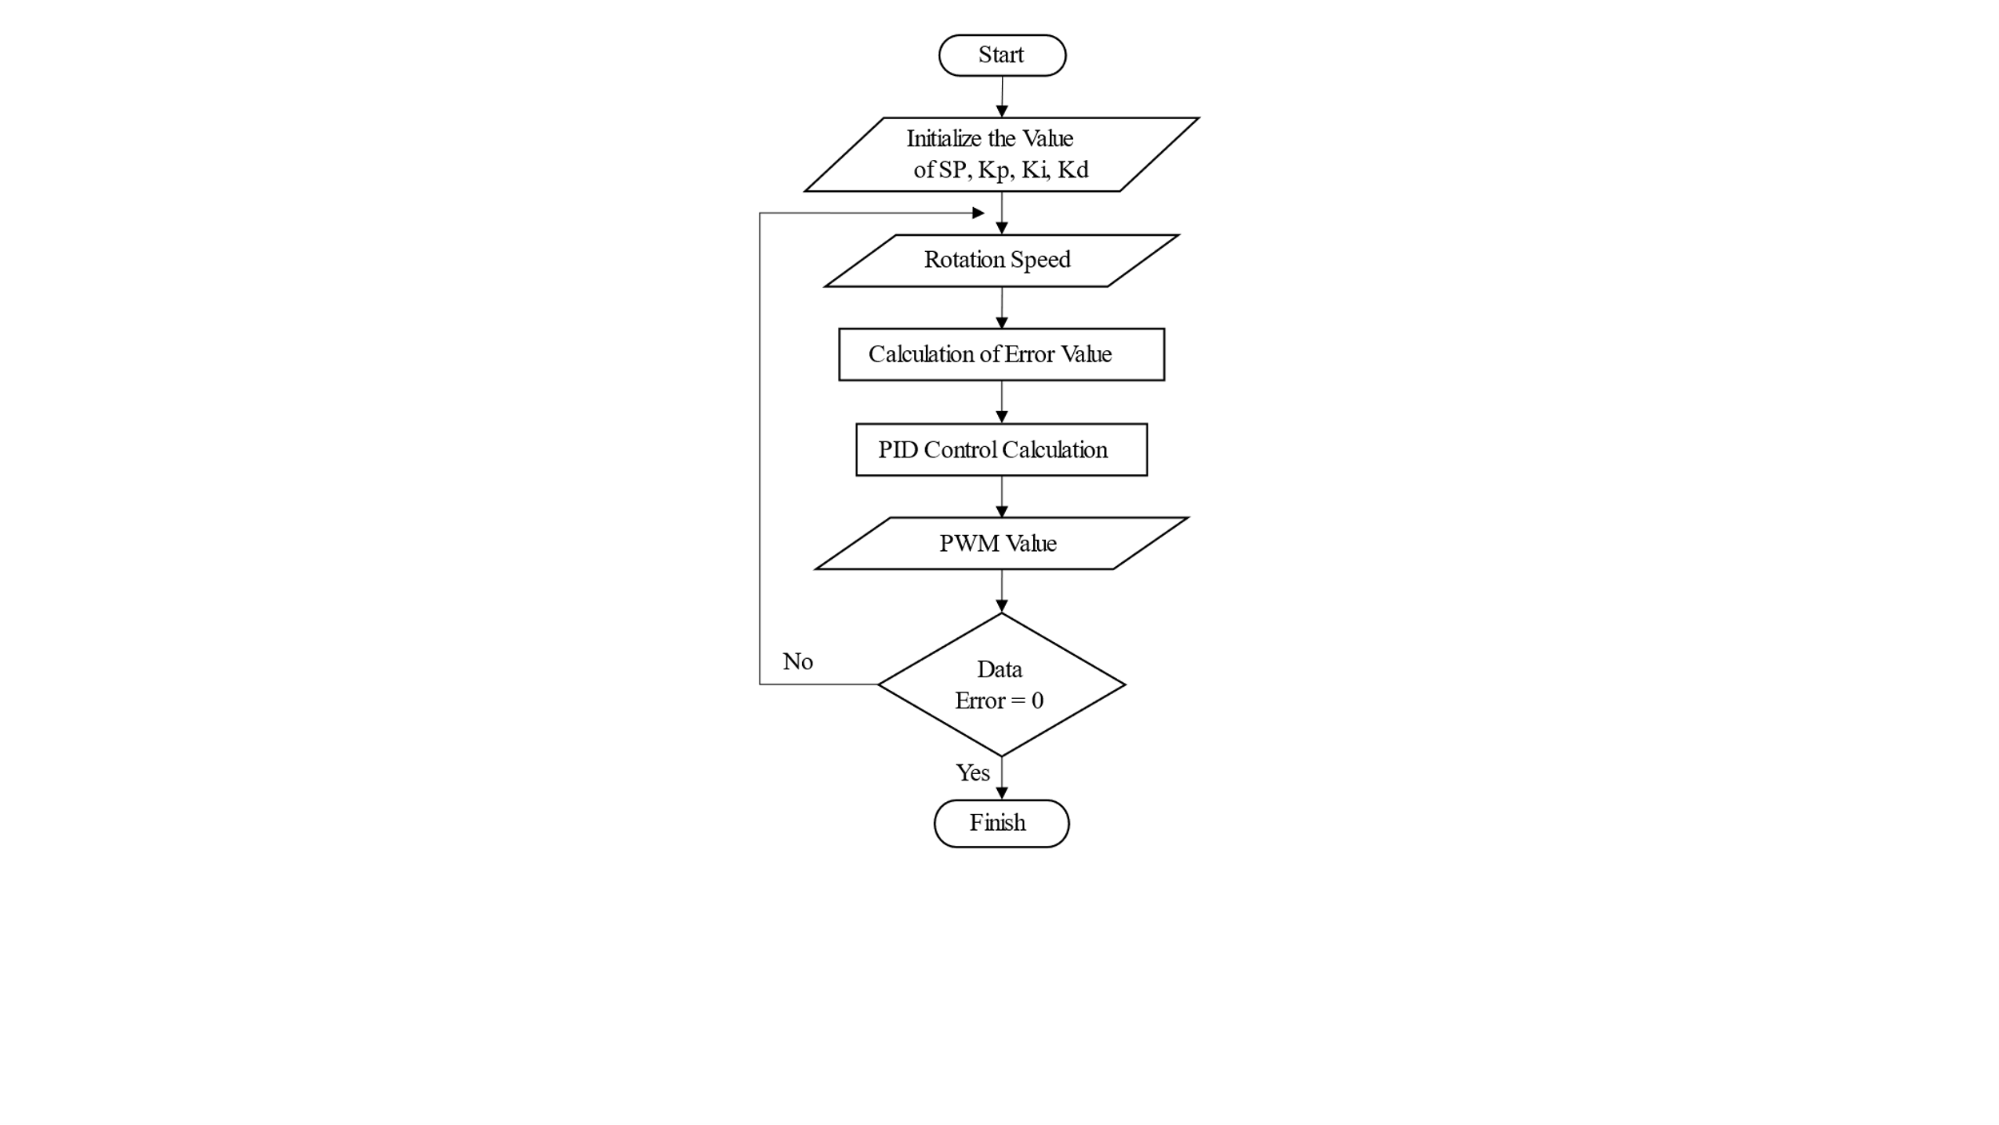
- PID control flowchart
Wiring Diagram
Wiring diagram is the process of connecting one electronic component with another using a cable or on a PCB board (Printed Circuit Board). All components are recommended to be connected to the Arduino Mega microcontrollers. The system wiring diagram can be seen in Fig. 8.
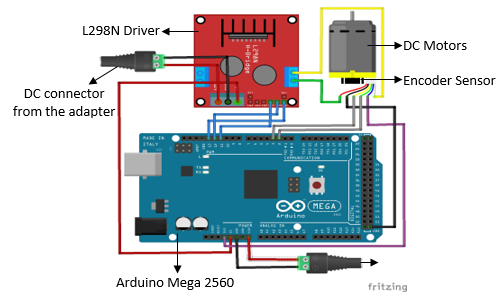
- Wiring diagram
Result and Discussion
DC motor PID testing is carried out to obtain data from the system so that it can be known the working ability of the system that has been designed. To be able to produce PID data, it is necessary to design a hardware system such as Fig. 9.
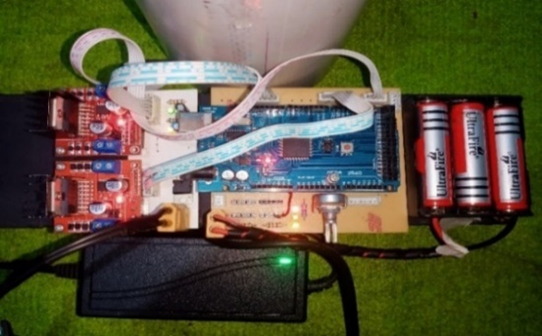
- Design of PID control system
L298N Driver Testing
L298N driver testing was carried out to be able to see the value of the voltage coming out of the driver against the varying PWM input values of 75, 125, 175, 225, 250. The PWM value of the motor is given a PID control to obtain a stable voltage value. The L298N driver is directly connected with voltages from the adapter of 5V and 12 V DC. L298N driver test data can be seen in Table I.
TABLE I. L298N Driver Test Data
No. | Type of IC(Integrated Circuit) | PWM | L298N Driver Voltage |
Input (Volt) | Output (Volt) |
1. | IC L298N(Dual H Bridge) | 75 | 12 | 2.12 |
2. | 125 | 12 | 7.17 |
3. | 175 | 12 | 8.85 |
4. | 225 | 12 | 9.66 |
5. | 250 | 12 | 10.19 |
In this test, PWM values were given variably with values of 75, 125, 175, 225, and 250. The smaller the PWM value given, the driver will provide a low voltage to supply the DC motor.
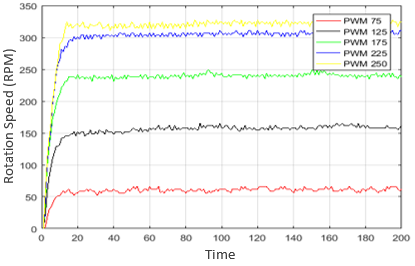
- PWM system response graph
Based on Fig. 10. it shows that the smaller the PWM value given, the lower the rotational speed of the resulting motor. In this test, the motor speed produced was due to the influence of the PID controller, so as to get a different system response.
DC Motor Speed Calibration Testing
DC motor speed calibration testing is carried out with PID controllers. The test was carried out as many as 5 times with the PWM values used were 75, 125, 175, 225, and 250. After calibration testing, results such as Table II were obtained.
Calibration testing is carried out using the best PID controller which is 0.6; 0.3; 0.01. Calibration is carried out using the Tachometer tool to compare the error rate of calculation between the measuring instrument and the program on the system created.
TABLE II. Calibration Data
No. | PWM | Tachometer Testing | System Testing | Calibration Results |
1. | 75 | 231.4 | 212 | 231.4 / 212 = 1.091 |
2. | 125 | 355.3 | 323 | 355.3 / 323 = 1.1 |
3. | 175 | 426.4 | 394 | 326.4 / 394 = 0.828 |
4. | 225 | 444.2 | 405 | 444.2 / 405 = 1.096 |
5. | 250 | 446.8 | 405 | 446.8 / 405 = 1.103 |
Proportional Control Testing (P)
The proportional control (P) can be applied by multiplying the error value by the value of the control parameter P. The error value is generated from subtracting the set point value by the resulting RPM (Revolution Per Minute). Proportional control testing (P) show in Table III.
TABLE III. Proportional Control Testing (P)
| Rise Time ( | Over Shoot ( ) ) | Peak Time ( ) ) | Settling Time () | Error |
1.0 | NaN | 0 | 4 | NaN | 104 |
3.0 | 3.7143 | 0 | 5 | NaN | 53 |
5.0 | 3.2143 | 0 | 6 | NaN | 30 |
7.0 | 3.3985 | 0 | 6 | NaN | 24 |
9.0 | 3.7080 | 0 | 41 | NaN | 21 |
Based on Table I, experiments were carried out 5 times with different variations in parameter values. The value of the parameter used is =1.0; K =3.0; =5.0; =7.0; =9.0.
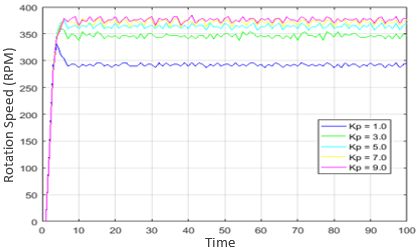
- Proportional control response (P)
Based on Fig. 11. the response of the system has not arrived at the set point value and cannot follow the steady state. This test must be carried out by giving various values of control parameters P. to be able to reach the set point value. The system response by providing different values of parameters P, I produces the values of rise time, overshoot, peak time, settling time, and error as in Table III.
Proportional (P) and Intergral Control Testing (I)
The test is carried out by providing various P parameter values and I parameter values. The test was carried out 5 times.
TABEL IV. Proportional (P) dan Integral (I) Control Testing
|
| Rise Time ( ) ) | Over Shoot () | Peak Time () | Settling Time () | Error |
1.0 | 0.3 | 3.2203 | 0.2500 | 22 | 98.3333 | 2 |
3.0 | 0.5 | 3.3985 | 0 | 15 | 91.3333 | 2 |
5.0 | 0.7 | 3.8722 | 0 | 32 | NaN | 11 |
7.0 | 0.9 | 3.3393 | 0 | 11 | 98.3333 | 2 |
9.0 | 1.0 | 3.4835 | 0 | 11 | NaN | 11 |
Based on Table IV, experiments were carried out 5 times with varying variations in the values of the and  parameters. The parameter used is =1.0; K=3.0; =5.0; =7.0; =9.0. Meanwhile, the value of the parameter used is =0.3; =0.5; =0.7; =0.9; =1.0.
Based on Fig. 12. using variations in  and values, it was found that the system's response results had almost reached the set point. System responses by providing different P and I value parameters can result in different rise time, overshoot, peak time, settling time, and error values. the result of the value is based on the conversion display of the output data on Arduino to MATLAB. The results of data conversion can be seen in Table IV.
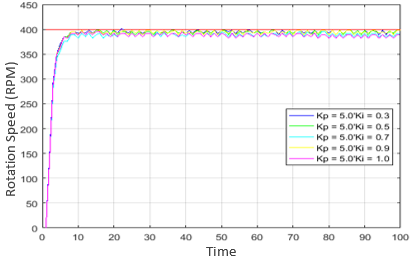
- Response control system Integral (I)
Proportional (P), Intergral (I), and Derivative (D) Control Testing
Tests are performed by providing varying values of control parameters P, I and D. The test was carried out in five attempts.
TABLE V. Control Testing of P, I, and D
|
| Rise Time () | Over Shoot () | Peak Time () | Settling Time () | Error |
|
1.0 | 0.3 | 0.1 | 2.8453 | 1.7500 | 15 | 7.1111 | -7 |
3.0 | 0.5 | 0.2 | 2.8741 | 1.0000 | 58 | 47.1111 | 0 |
5.0 | 0.7 | 0.3 | 2.7049 | 2.5000 | 76 | 76.2000 | -7 |
7.0 | 0.9 | 0.4 | 2.8453 | 2.5000 | 97 | NaN | -10 |
9.0 | 1.0 | 0.5 | 2.9892 | 2.5000 | 15 | 99.6667 | -7 |
In Table V, the test of control of P, I, and D was performed five times with varying variations in the values of the , , and parameters. The value of the parameter used is =1.0; =3.0; =5.0; =7.0; =9.0, and the parameter used is =0.3; =0.5; =0.7; =0.9; =1.0, while the parameter used is =0.1; =0.2; =0.3; =0.4; =0.5.
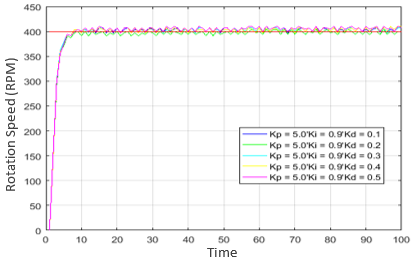
- Response control system D
Based on Fig. 13. using varying variations in , , and values, the results of the system response have reached the set point. System responses by providing different parameters of P, I, and D values can result in different rise time, overshoot, peak time, settling time, and error values. the result of the value is based on the conversion display of the output data on the Arduino to MATLAB.
The results of data conversion can be seen in table 5. In this part of the test, there is an overshoot value that is calculated because the response from the graph exceeds the given set point value. The error value displayed also affects because the graph has exceeded the set point limit so that the error produces a minus (-) value.
Best PID control control testing
The best PID control testing is performed by providing fixed values of the control parameters P, I, and D. and the values of the varied  parameters. The test was carried out in five attempts.
TABLE VI. Best PID control testing
|
|
| Rise Time () | Over Shoot () | Peak Time () | Settling Time () | Error |
0.6 | 0.3 | 0.01 | 2.9062 | 0.7500 | 11 | 7.2857 | 3 |
0.6 | 0.3 | 0.02 | 2.7297 | 1.7500 | 15 | 9.9375 | 3 |
0.7 | 0.3 | 0.07 | 2.6202 | 1.7500 | 25 | 5.7059 | 3 |
1.0 | 0.3 | 0.1 | 2.7368 | 0.7500 | 11 | 5.9474 | 3 |
3.0 | 0.3 | 0.2 | 2.7297 | 1.7500 | 83 | 7.1538 | 3 |
Table VI is generated from the calculation of Arduino data that is converted using MATLAB so that it produces the values of rise time, overshoot, peak time, settling time, and error. The system response graph data can be seen in Fig. 11.
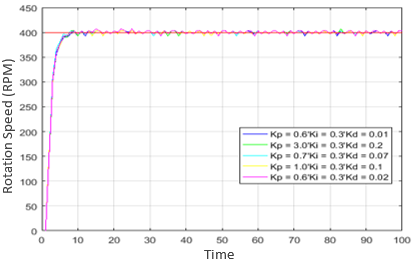
- Best PID system response
Based on Fig. 14. of the best PID system response in this test, it can produce overshoot values. Overshoot occurs because the system response exceeds the given set point value. And the smaller error value from the previous experiment indicates that the control of P, I, D is stable enough to be applied to DC motors.
The control must do various ways, namely by changing the control parameter values of , , and variously, this technique is called the trial and error technique in order to get the best P, I, D response values.
PID Control Testing with Air Load
PID control testing when given mineral water loads is carried out by changing the parameters of , , and variably to achieve the stable rotation of the DC motor. The parameter data can be seen in Table VII.
TABLE VII. Testing with Weights
|
|
| Rise time () | Over shoot () | Peak time () | Settling time () | Steady State Error |
2.0 | 0.9 | 0.2 | 2.8618 | 3.2500 | 57 | 99.6250 | -5 |
2.9 | 0.8 | 0.4 | 3.1778 | 2.7500 | 97 | 97.3750 | -7 |
3.0 | 0.9 | 0.2 | 2.9834 | 2.7500 | 88 | 88.2727 | -7 |
4.1 | 1.0 | 0.9 | 3.5718 | 2.5000 | 20 | 20.2500 | -2 |
5.5 | 1.5 | 0.4 | 3.0404 | 2.7500 | 64 | 95.4286 | 0 |
The resulting data is in the form of rise time, overshoot, peak time, settling time, steady state error. The experiment was conducted five times with different parameter values.
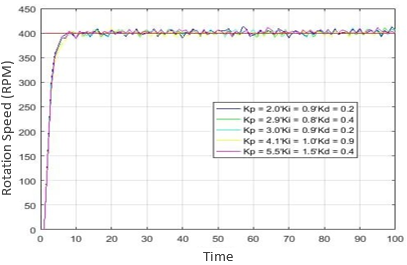
- Testing with weight
Based on Fig. 15. dc motor response performance results when given a water load with a set point value of 400 RPM with parameter values , , according to Table 4.7. The parameter values used are the best parameter values that have been tested, and result in rise time, fast settling and fairly small overshoot values. The initial response in this parameter of the system response value can be stable at the given set point value.
System Testing in Open Spaces
PID control testing in open spaces is carried out by changing the parameters of , and variably to achieve DC motor rotation stability. The parameter data can be seen in Table VIII.
TABLE VIII. No-load Testing
|
|
| Rise time () | Over shoot () | Peak time () | Settling time () | Steady State Error |
0.6 | 0.3 | 0.01 | 2.9062 | 0.7500 | 11 | 7.2857 | 3 |
0.6 | 0.3 | 0.02 | 2.7297 | 1.7500 | 15 | 9.9375 | 3 |
0.7 | 0.3 | 0.07 | 2.6202 | 1.7500 | 25 | 5.7059 | 3 |
1.0 | 0.3 | 0.1 | 2.7368 | 0.7500 | 11 | 5.9474 | 3 |
3.0 | 0.3 | 0.2 | 2.7297 | 1.7500 | 83 | 7.1538 | 3 |
Table VIII is the result of the system response obtained using MATLAB software. The resulting data is in the form of rise time, overshoot, peak time, settling time, steady state error. The system response graph data can be seen in Fig. 16.
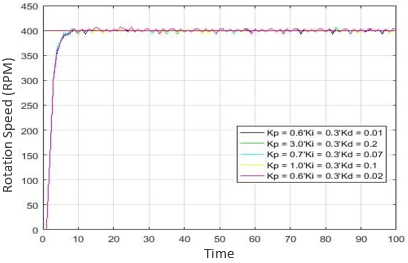
- No-load testing
Fig. 16. is a graph of the response of the DC motor system when in an open room. The test was carried out as many as 5 times by providing parameter values , and as in Table VIII. The sistem response results in a smaller overshoot value and the system stabilizes at set point 400.
Conclusion
The PID control system used uses a closed loop system where the control depends on the system output or through feedback. The trial and error method is used to find the best PID parameters by varying the values of the , and parameters to be able to provide the best system response that can be stable at the specified set point.
The PID controller response when the DC motor is given a load affects the resulting rotational response, the speed of the DC motor decreases further so that it is necessary to change the parameters of , and . The greater the load given to the DC motor, the more it will affect the rotational speed.
The speed of the DC motor can be affected by different PWM inputs. The PWM signal can be obtained in various ways, such as on a microcontroller by generating a PWM signal on the motor driver IC circuit. If the PWM value is low, the width of the pulse produced will be smaller, thus affecting the speed of the DC motor due to the division of voltage output.
Reference
[1] A. Ma’arif, N. Rahmat Setiawan, and E. Suci Rahayu, “Embedded Control System of DC Motor Using Microcontroller Arduino and PID Algorithm”, ITJRD, vol. 6, no. 1, pp. 30-42, 2021., https://doi.org/10.25299/itjrd.2021.vol6(1).6125.
[2] A. Latif, A. Z. Arfianto, H. A. Widodo, R. Rahim, dan E. T. Helmy, “Motor DC PID system regulator for mini conveyor drive based-on matlab,” J. Robot. Control, vol. 1, no. 6, pp. 185–190, 2020, https://doi.org/10.18196/jrc.1636.
[3] M. M. Maung, M. M. Latt, dan C. M. Nwe, “DC Motor Angular Position Control using PID Controller with Friction Compensation,” Int. J. Sci. Res. Publ., vol. 8, no. 11, 2018, https://doi.org/10.29322/IJSRP.8.11.2018.p8321.
[4] K. S. Chia, “Ziegler-nichols based proportional-integral-derivative controller for a line tracking robot,” Indones. J. Electr. Eng. Comput. Sci., vol. 9, no. 1, pp. 221–226, 2018, https://doi.org/10.11591/ijeecs.v9.i1.pp221-226.
[5] D. İzci dan S. Ekinci, “Comparative performance analysis of slime mould algorithm for efficient design of proportional–integral–derivative controller,” Electrica, vol. 21, no. 1, pp. 151–159, 2021, https://doi.org/10.5152/electrica.2021.20077.
[6] E. Widya Suseno dan A. Ma’arif, “Tuning of PID Controller Parameters with Genetic Algorithm Method on DC Motor,” Int. J. Robot. Control Syst., vol. 1, no. 1, pp. 41–53, 2021, https://doi.org/10.31763/ijrcs.v1i1.249.
[7] H. Hu, T. Wang, S. Zhao, dan C. Wang, “Speed control of brushless direct current motor using a genetic algorithm–optimized fuzzy proportional integral differential controller,” Adv. Mech. Eng., vol. 11, no. 11, pp. 1–13, 2019, https://doi.org/10.1177/1687814019890199
[8] J. Abraham dan S. Shrivastava, “Dc Motor Speed Control Using Machine Learning Algorithm,” Int. J. Eng. Res. Technol., vol. 7, no. 04, pp. 456–470, 2018, [Online]. Available on: www.ijert.org.
[9] S. J. Hammoodi, K. S. Flayyih, dan A. R. Hamad, “Design and implementation speed control system of DC motor based on PID control and matlab simulink,” Int. J. Power Electron. Drive Syst., vol. 11, no. 1, pp. 127–134, 2020, https://doi.org/10.11591/ijpeds.v11.i1.pp127-134.
[10] M. K. Joyo et al., “Optimized proportional-integral-derivative controller for upper limb rehabilitation robot,” Electron., vol. 8, no. 8, 2019, https://doi.org/10.3390/electronics8080826.
[11] T. Herlambang, Subchan, dan H. Nurhadi, “Design of motion control using proportional integral derivative for UNUSAITS AUV,” Int. Rev. Mech. Eng., vol. 12, no. 11, pp. 928–938, 2018, https://doi.org/10.15866/ireme.v12i11.15758.
[12] M. R. Khan, A. A. Khan, dan U. Ghazali, “Speed Control of DC Motor under Varying Load Using PID Controller,” Int. J. Eng., vol. 9, no. 3, pp. 38–48, 2015, https://citeseerx.ist.psu.edu/document?repid
[13] M. W. Fatma dan M. I. Hamid, “PWM speed control of dc permanent magnet motor using a PIC18F4550 microcontroller,” IOP Conf. Ser. Mater. Sci. Eng., vol. 602, no. 1, 2019, https://doi.org/10.1088/1757-899X/602/1/012017.
[14] K. Priyanka dan A. Mariyammal, “Dc Motor Speed Control Using Magnetic Amplifier,” Int. J. Recent Trends Eng. Res., vol. 3, no. 2, pp. 584–587, 2018, https://doi.org/10.23883/IJRTER.2018.4273.TN5B3.
[15] M. A. Ibrahim, A. K. Mahmood, dan N. S. Sultan, “Optimal PID controller of a brushless DC motor using genetic algorithm,” Int. J. Power Electron. Drive Syst., vol. 10, no. 2, pp. 822–830, 2019, https://doi.org/10.11591/ijpeds.v10.i2.pp822-830.
[16] M. Daud, V. Handika, dan A. Bintoro, “Design and realization of fuzzy logic control for Ebb and flow hydroponic system,” Int. J. Sci. Technol. Res., vol. 7, no. 9, pp. 138–144, 2018, http://www.ijstr.org/final-print/sep2018/Design-And-Realization-Of-Fuzzy-Logic-Control-For-Ebb-And-Flow-Hydroponic-System.pdf.
[17] P. Peerzadaa, W. H. Larika, dan A. A. Maharb, “DC Motor Speed Control Through Arduino and L298N Motor Driver Using PID Controller,” Int. J. Electr. Eng. Emerg. Technol., vol. 4, no. 2, pp. 21–24, 2021, http://www.ijeeet.com/index.php/ijeeet/article/view/94.
[18] A. Musyafa’, I. Abadi, R. D. Noriyati, M. F. Afif, dan M. K. Asy’ari, “Design and Implementation Wind Turbine Power Control System Base Particle Swam Optimization at Low Rate Wind Farm,” Int. J. Mech. Mechatronics Eng. IJMME-IJENS, vol. 19, no. 5, pp. 149–157, 2019, https://scholar.googleusercontent.com.
[19] E. S. Rahayu, A. Ma’arif, dan A. Çakan, “Particle Swarm Optimization (PSO) Tuning of PID Control on DC Motor,” Int. J. Robot. Control Syst., vol. 2, no. 2, pp. 435–447, 2022, https://doi.org/10.31763/ijrcs.v2i2.476.
[20] A. Idir, M. Kidouche, Y. Bensafia, K. Khettab, dan S. A. Tadjer, “Speed control of DC motor using PID and FOPID controllers based on differential evolution and PSO,” Int. J. Intell. Eng. Syst., vol. 11, no. 4, pp. 241–249, 2018, https://doi.org/10.22266/ijies2018.0831.24.
[21] P. Vikhe, N. Punjabi, dan C. Kadu, “Real Time DC Motor Speed Control using PID Controller in LabVIEW,” Int. J. Adv. Res. Electr. Electron. Instrum. Eng., vol. 03, no. 09, pp. 12162–12167, 2014, https://doi.org/10.15662/ijareeie.2014.0309046.
[22] S. Ibrahim Khather, M. Almaged, dan A. I. Abdullah, “Fractional order based on genetic algorithm PID controller for controlling the speed of DC motors,” Int. J. Eng. Technol., vol. 7, no. 4, pp. 5386–5392, 2018, https://scholar.googleusercontent.com.
Qolil Ariyansyah, DC Motor Speed Control with PID Control (Proportional Integral Derivative) on The Prototype of a Mini-Submarine