Journal of Fuzzy Systems and Control, Vol. 3, No 1, 2025 |
Monitoring the Technical Condition of Traction Substation Equipment using Thermal Imaging Technologies and Machine Vision Methods
G. Ermachkov 1, , V. Nezevak 2,*
1, 2 Omsk State Transport University, Omsk, Russia
Email: 1 gl.ermachkov@gmail.com, 2 nezevakwl@mail.ru
*Corresponding Author
Abstract—This article discusses the development and application of machine vision technologies and thermal imaging diagnostics for monitoring the technical condition of traction substation equipment. The focus is on improving the efficiency and reliability of detecting equipment overheating and identifying potential failures by integrating image processing methods with thermal monitoring systems. Previous studies have demonstrated the effectiveness of using thermal imaging for detecting overheating zones in electrical equipment, such as transformers, switchgear, and high-voltage cables. Recent works have also applied machine vision techniques for the automated analysis of temperature distribution and defect detection in substation equipment. However, the integration of these methods for real-time diagnostics and predictive maintenance is still in its early stages. In comparison with previous research, this article presents a novel combined approach that combines thermal imaging data with machine learning models to predict temperature trends and identify early signs of thermal aging in equipment. Unlike prior studies that focused primarily on static analysis of thermal images, this work contributes by proposing a dynamic monitoring system that continuously evaluates the thermal condition of key substation components.
Keywords—Thermal Imaging Technologies; Battery Systems; Infrared Imaging; Machine Vision; Failure Prediction
Monitoring the technical condition of traction substation equipment is critical for ensuring the reliable and safe operation of power systems. The use of thermal imaging technologies has become an effective tool for diagnosing equipment by identifying overheating zones, which are often precursors to failures. High temperatures can indicate various faults, such as loose connections, insulation breakdowns, or overloading, which, if not addressed promptly, can lead to equipment damage or even catastrophic failures. The development of machine vision methods has further enhanced the capabilities of thermal imaging systems, enabled automated, real-time monitoring and reducing the need for manual inspections.
Previous studies have demonstrated the usefulness of thermal imaging for detecting hotspots in substation equipment. For example, researchers have applied thermal cameras to monitor transformers, switchgear, and high-voltage cables, showing that regular thermal inspections can prevent failures by identifying areas with abnormal heat distribution [1][2]. Machine vision techniques have also been successfully integrated into power system diagnostics to improve the efficiency of analyzing large volumes of thermal data. In one study, an automated diagnostic system for traction electrical supply devices was proposed, utilizing intelligent methods to enhance fault detection and operational efficiency. This system focused on classifying potential failures based on specific patterns and diagnostic models, contributing to the reduction of human error in equipment monitoring [3]. Another approach applied image segmentation techniques to isolate overheated components from their surroundings, providing a more detailed analysis of the equipment’s thermal condition [4].
Despite these advances, there remains a gap in the integration of thermal imaging and machine vision for real-time monitoring and predictive maintenance. Many existing studies have focused on static analysis of thermal images, relying on periodic inspections rather than continuous monitoring. Additionally, the predictive capabilities of current systems are often limited to threshold-based alerts, lacking advanced algorithms that can forecast potential failures based on historical data trends.
Our research addresses these limitations by developing a novel system that combines thermal imaging with machine learning models to predict temperature trends in traction substation equipment. Building upon the work of [3] and [4], we propose a dynamic monitoring solution that not only detects hotspots but also predicts the future behavior of critical components. Our system introduces a new algorithm for detecting abnormal temperature patterns, leveraging historical data to improve fault prediction accuracy. This approach not only inherits the strengths of previous studies but also surpasses them by offering continuous monitoring and advanced predictive analytics.
The motivation behind this article is to fill the gap in existing research by providing a comprehensive solution that enhances the reliability and efficiency of traction substation equipment diagnostics. By addressing the limitations of static image analysis and threshold-based predictions, this work aims to reduce unplanned outages and extend the lifespan of critical power infrastructure.
Machine vision plays a key role in automating the processes of equipment diagnostics and condition monitoring. Modern machine vision systems are capable of performing complex tasks such as defect detection, failure prediction, operational performance analysis, and ensuring the safe operation of equipment. These technologies are already actively used in industries such as manufacturing, energy, transportation, and other sectors where the reliability and promptness of diagnostics are critical for maintaining production processes at a high level [1]-[3].
One of the most common tasks in machine vision is the automated visual inspection of equipment for defects. For this purpose, methods such as texture analysis, pattern recognition, and neural network models like convolutional neural networks (CNN) are employed. CNNs can be trained on datasets of images with and without defects, allowing the system to detect even the slightest deviations from the norm in real-time [4][5].
Infrared (thermal) cameras are used to diagnose equipment by analyzing heat distribution on its surface. Modern machine vision technologies can process thermographic images, automatically identifying abnormal overheating zones, which may indicate the following conditions:
Using infrared analysis enables the timely detection and correction of potential faults before they lead to complete equipment failure. Neural networks and segmentation algorithms can be applied for accurate analysis of thermal maps and highlighting areas with anomalies [6].
With the help of machine vision technologies and machine learning algorithms, predictive maintenance systems can be implemented. These systems analyze equipment condition in real-time and predict possible failures based on accumulated data [7][8].
Thermal monitoring has become one of the most effective methods for assessing the technical condition of electrical equipment. It enables real-time evaluation of temperature distribution on the surface of devices and the identification of hidden defects that could lead to equipment failure. A key feature of this method is its ability to detect thermal aging processes, which negatively impact on the lifespan and operational characteristics of the equipment. This article explores how thermal monitoring, augmented by machine vision technologies, can detect thermal aging and prevent failures of electrical equipment.
Thermal monitoring can be applied to assess the condition of various elements in the power system, such as power transformers, high-voltage cables, connection and switching devices, circuit breakers, and batteries [9]-[11], among others.
Thermogram analysis enables the detection of thermal aging, which leads to material degradation and reduced equipment lifespan. This study presents a method for assessing the technical condition of traction substation batteries using machine vision algorithms. The application of this approach will help predict potential failures, optimize the operation of batteries and other equipment, and ensure their reliable long-term performance.
This section of the article discusses the process of forming the data set for monitoring the temperature of the battery and the methods for processing it. The monitoring is implemented using data that includes optical images and thermograms. Optical images are photographs of the battery captured with a standard camera, providing visual information about the battery’s condition, including the color of terminals and sections. Thermograms, on the other hand, are obtained using an infrared camera and display the temperature distribution across the battery's surface, allowing the identification of hotspots and the analysis of temperature anomalies.
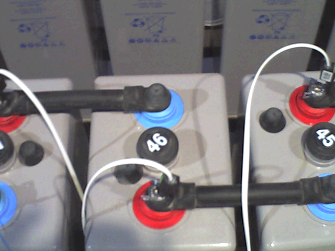
Data collection can be performed both in real-time and in stages. For this study, a set of color optical images and thermograms was obtained for all sections of the traction substation battery, under various operating conditions, using Testo series thermal imagers (Fig. 1).
To ensure comprehensive monitoring, additional sensors can be used to record ambient temperature, battery temperature, humidity, current load, and battery voltage.
a | b |
When monitoring batteries, optical images provide essential information about the condition and configuration of the batteries. These images can be used to highlight individual batteries or sections of batteries (e.g., by shelves), identify the color of terminals, and recognize numerical markings on the battery surface. To solve these tasks, a series of image processing steps must be performed.
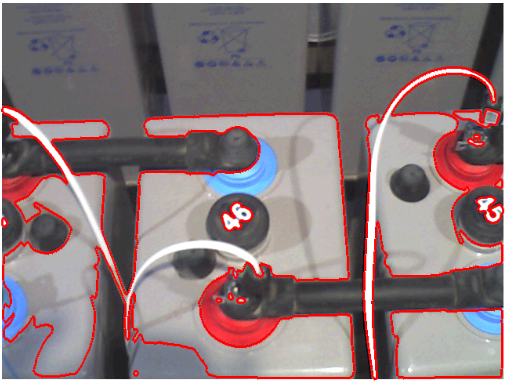
The first step in processing optical images is isolating individual battery sections. For this, image segmentation methods are applied, which allow the image to be divided into areas corresponding to each section [12].
The initial preprocessing starts with improving image quality [13]. For this task, a Gaussian filter is applied (1):
| (1) |
where G(x,y) — the value of the filter at the point (x, y);
σ — the standard deviation that determines the level of blur;
(x, y) — the coordinates of the pixel relative to the filter center.
The binarization method converts the image into a black-and-white format based on a brightness threshold value [14]. This allows for the separation of the objects of interest (battery sections) from the background. For example, all pixels with brightness levels I(x, y) higher than a given threshold T become white (2):
| (2) |
where  — is the intensity of the pixel at point (x, y),
  — is the binarized image.
After binarization, morphological operations such as dilation and erosion are applied. These operations help enhance the contour extraction of the sections, smooth boundaries, or fill gaps within areas [15].
After performing morphological operations, the contours of each section can be extracted using the Canny algorithm or the Sobel edge detection method [16]. This allows the separation of each battery section for further analysis (Fig. 2, a). The Sobel gradient is computed as (3):
| (3) |
where  ,
,  — are the intensity derivatives in the horizontal and vertical directions, respectively.
The overall gradient is calculated as (4):
| (4) |
Determining the color of the terminals is an important step for diagnosing the condition of the batteries. Colored terminals may vary by polarity, connection status, wear, oxidation, etc. Optical images are typically in RGB format [17], where the color is defined by three components—red (R), green (G), and blue (B) (5):
| (5) |
where  — are the intensity values of the red, green, and blue channels for each pixel
  .
.
For more precise color analysis, conversion to other color spaces, such as HSV (Hue, Saturation, Value), is often used. This method allows for more effective separation of the hue H from brightness V and saturation S [18]. The conversion from RGB to HSV is performed using the following equations (6):
| (6) |
Based on the selected color space, thresholds can be set to identify terminal regions of the desired color. For instance, to isolate positive polarity terminals in the HSV space [19], a specific range of color values for red can be defined (7):
| (7) |
where  — are the set threshold values for red color.
Clustering methods, such as k-means, can be useful for separating different color regions [20]. The k-means method groups pixels based on their color values, minimizing the variance within clusters (8):
| (8) |
where k— is the number of clusters;
 — are the obtained i-th clusters;
 — are the centroids of all vectors from cluster .
The results of determining the coordinates for the positive battery terminals (Fig. 2(a)) based on the red color are shown in Fig. 2(b).
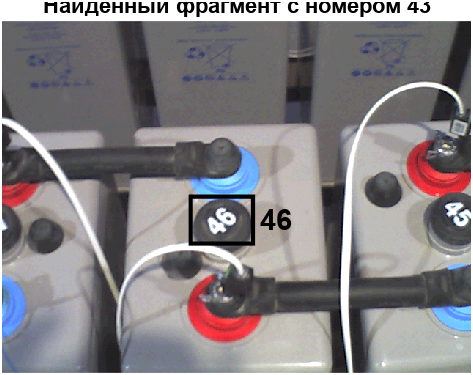
To recognize numbers, OCR (Optical Character Recognition) is used a set of algorithms that can identify textual elements in an image. The primary task of OCR is to extract text characters from a digital image based on pixel brightness analysis [21]. One widely used OCR method is Tesseract, which employs a multilayer neural network for character classification [22]. Each pixel of the image is represented as a vector fed into the neural network, which identifies numerical values [23].
a | b |
The application of the Tesseract method [24] is mathematically described as follows: the image is divided into fragments, and for each fragment S(x,y) the probability of belonging to each numerical class c_i is calculated via the probability function (9):
| (9) |
where  — is the output of the neural network for class i;
N — is the number of classes (in this case, numbers from 0 to 9).
After number recognition, additional methods can be applied to verify the correctness of the recognized characters. For example, a condition can be set for the range of acceptable numbers for batteries (10):
| (10) |
where  — are the minimum and maximum possible section numbers.
The result of recognizing the battery section number is presented in Fig. 3.
Thus, a comprehensive approach to processing optical images enables the automation of monitoring the technical condition of batteries and enhances the accuracy of real-time condition assessments.
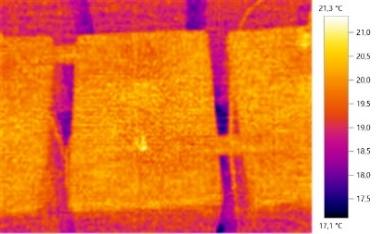
Thermogram analysis allows for the identification of overheating zones, determining the condition of terminals, and predicting the further temperature behavior of the battery, which is crucial for assessing battery lifespan and preventing failures. The main task here is the accurate determination of temperature distribution on the surfaces of battery sections. For this, image processing and data analysis methods are employed that convert infrared images into temperature maps, where each pixel corresponds to a specific temperature value [25].
Thermograms contain a temperature scale that shows the correspondence of pixel intensity to temperature values. To obtain accurate data, it is necessary to calibrate the image, matching the intensity values of each pixel with real temperature values. After calibration, a thermal map of the batteries is constructed. This map shows the temperature distribution across the entire surface, allowing for the identification of areas with elevated temperatures.
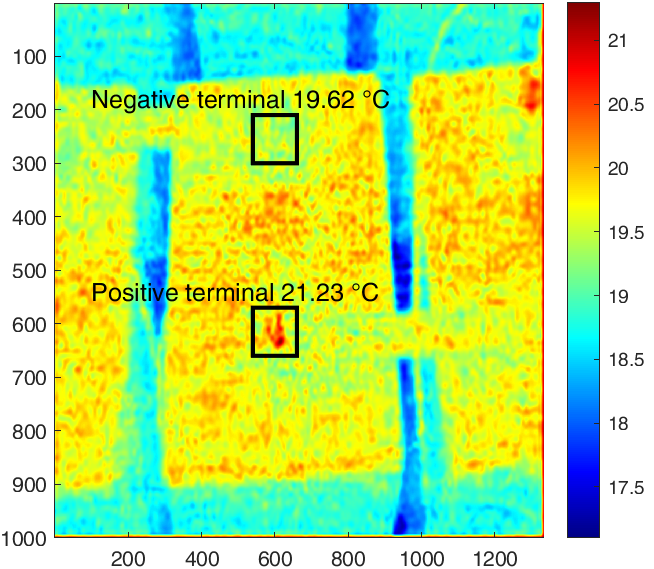
To determine the temperature of the terminals, their localization on the thermogram is performed initially. The task of finding the coordinates of the terminals and subsequently localizing them on the thermogram is solved using the optical image of the corresponding battery (Fig. 2(b)). For each battery terminal, the maximum temperature is measured based on the pixels corresponding to the highlighted area (Fig. 4). These data are then analyzed to identify abnormal temperature values that may indicate malfunctions.
To predict the temperature of the batteries in operation, regression models can be used that are trained on accumulated diagnostic data and can forecast the surface temperature of the battery based on current operating conditions and load.
Temperature directly affects the lifespan of battery systems. As the operating temperature increases, the degradation of active battery components accelerates, which reduces both lifespan and residual capacity. One common model for calculating battery lifespan is based on Arrhenius' law, which describes the dependence of the rate of chemical reactions (aging rate) on temperature [26]. To estimate the rate of degradation of batteries, the following expression is used (11):
| (11) |
where R — is the degradation rate,  — is the initial rate,
  — is the activation energy, k — is the Boltzmann constant, T — is the temperature.
According to Arrhenius' law, an increase in temperature above 20°C by every 10°C reduces lifespan by 50%. Assuming this statement holds true, using exponential interpolation based on data regarding lifespan reduction as a function of temperature [27], a model reflecting the change in the number of cycles 𝑁𝑇% as a function of temperature T is obtained (12):
| (12) |
The results of processing thermogram images for batteries operating in constant charge mode allow for an assessment for each battery. As an example, a fragment of tabular data on the results of temperature map assessments and degradation rates is presented in Table 1.
The analysis of thermograms for battery systems plays a key role in diagnosing their condition and predicting lifespan. Accurate measurements of temperature distribution on the battery surfaces and terminals, as well as temperature predictions, allow for the timely identification of potential issues and proactive measures to prevent overheating and premature degradation, while also enabling timely assessments of thermal compensation effectiveness during battery charging and considering temperature regimes in determining residual capacity.
Battery No. | Positive terminal | Negative terminal | Battery surface, Tavg, °С | 𝑁𝑇% | ||
Tmax, °С | Tavg, °С | Tmax, °С | Tavg, °С | |||
30 | 22.63 | 21.16 | 19.58 | 18.15 | 21.20 | 93 |
31 | 21.13 | 20.89 | 18.02 | 16.23 | 21.89 | 89 |
32 | 24.51 | 23.49 | 17.64 | 15.66 | 21.21 | 93 |
33 | 19.35 | 19.04 | 24.62 | 23.83 | 18.20 | 100 |
34 | 19.07 | 18.61 | 18.32 | 17.33 | 23.43 | 80 |
This study presents a method for monitoring traction substation batteries using optical and thermal imaging. The method includes the following stages: preprocessing, segmentation, morphological operations, color recognition, optical character recognition, thermogram analysis, temperature forecasting. The approach improves monitoring accuracy by automating image processing tasks such as segmenting battery sections, recognizing terminal colors, and extracting numerical markings.
Thermogram analysis enables the detection of developing defects and potential connection issues by mapping temperature distributions. The lifespan of batteries is estimated using Arrhenius' law, based on thermal aging models, which helps prevent overheating and extends battery life.
Future research could focus on enhancing real-time prediction algorithms for temperature behavior, integrating machine learning to improve fault diagnosis, and applying this approach to a broader range of battery types.
Prepared as part of the implementation of the state task No. EKTY-2024-0001 on the topic: "Development of an innovative DC and AC traction power supply system with intelligent control based on digital technologies".
G. Ermachkov, Monitoring the Technical Condition of Traction Substation Equipment using Thermal Imaging Technologies and Machine Vision Methods