Journal of Fuzzy Systems and Control, Vol. 3, No 1, 2025 |
Comparative Traditional Methods of Attributes with Fuzzy Quality Control Charts for Improving the Quality of a Product
Salman Hussien Omran 1,* , Salam Waley Shneen 2, , Moaz H. Ali 3, , Qusay A. Jawad 4, , Sabah A. Gitaffa 5, ,
Hayder Mahmood Salman 6,
1, 2 Energy and Renewable Energies Technology Centre, University of Technology–Iraq, Baghdad, Iraq
3 College of Engineering, University of Kerbala, Karbala, Iraq
3 Department of Computer Engineering Techniques, AlSafwa University College, Karbala, Iraq
4, 5 Electrical Engineering Department, University of Technology–Iraq, Baghdad, Iraq
6 Al-Turath University–Iraq, Baghdad, Iraq
Email: 1 salman.h.omran@uotechnology.edu.iq, 2 salam.w.shneen@uotechnology.edu.iq, 3 muezhm@hotmail.com,
4 qusay.a.almamoury@uotechnology.edu.iq, 5 sabah.a.gitaffa@uotechnology.edu.iq, 6 hayder.mahmood@uoturath.edu.iq
Abstract—The problems motivating the study, as a result of sudden changes in production quality levels, which affect the production process. Control charts are a major tool in statistical quality control. The aim of the study is to monitor the production quality of a product that is an engine used in the application of a hair dryer. The methodology followed, the hair dryer model was chosen to verify the possibility of improving the product quality using fuzzy logic and comparing the traditional Shewhart control charts (p-chart) with the fuzzy p-chart in the context of manufacturing, and the collected data were processed using Minitab 21 Statistical Software. The performance of a control chart using fuzzy logic was measured for the proposed industrial product type with specifications for 300 samples of the constant size and a production period of 25 days to identify the product quality. The basic criterion for drawing the chart using fuzzy logic depends on the fuzzy ordering function for each of w, λ and its values are within the limits of (0 < λ or w ≤ 1) is a weighting parameter. The necessary tests were conducted to monitor the product quality using (w = 0.1, 0.2) and (λ = 0.1, 0.2) when the fuzzy ordering function is used. Results, it was found that the fuzzy p-chart was more sensitive to process changes and could detect shifts in defect ratio faster and more accurately, the production process was under statistical control and within quality control limits, and the conventional deviation from nominal control charts showed a false alarm for the observation as out of control. Recommendations, the present method can be used to improve product quality and reduce defects for the motor department.
Keywords—Fuzzy Logic; Quality Control Charts; Attribute Control Charts; Statistical Quality Control
Statistical Quality Control (SQC) encompasses a range of statistical techniques used to monitor and control quality in manufacturing and service processes, SQC techniques are used extensively in manufacturing and service industries to improve the quality of products and services [1]. The major ones are Descriptive statistics, Statistical Process Control (SPC), and Acceptance sampling. These methods are crucial in ascertaining that processes are optimized to deliver conforming products [1][2]. Statistical Quality Control is an important element of Quality Management that uses statistical techniques for controlling the processes. Applying SPC tools, sampling acceptance plans and process capability studies will assist organizations to enhance their operations and product quality. QC needs to be constantly practiced and checked to be able to maintain control and guarantee long-term quality [3][4]. Statistical Quality Control is an important part of quality management as it uses statistical techniques to monitor and control process variability and enhance product quality. By the use of SQC tools like SPC, acceptance sampling, and process capability analysis, organizations can be able to attain superior quality [5][6].
Control charts are graphical means used to display data on a time scale and to detect any variation that lies beyond the control limits. Quality control charts are still essential in maintaining the consistency of processes as well as product quality in manufacturing and other industries Quality Control Charts, or control charts or Shewhart charts are basic tools of Statistical Process Control (SPC). They are employed to observe processes, check for change, and make sure that the process stays within set control limits. These charts are used to establish if there are any peculiar fluctuations that require correction because of a certain flaw, to establish the stability of the processes, and to determine the areas that require change [7][8].
Key Components of Quality Control Charts [8][9] include the center Line (CL): Which stands for the central value of the process, the most frequently used measure of central tendency. Upper Control Limit (UCL): The highest value within the scope of which the process should operate and any deviation from which is considered as a potential problem. Lower Control Limit (LCL): The lower limit or range of values assumed in the process of forecasting or estimation. Data Points: Show one variable or quantity per point in time. Control Limits: Usually it is set at ± 3 sigma, which means that the data points are in the range of normal variation and were expected to occur in production. The primary types of control charts include [10], X-bar, and R Charts: Applied for the control of the average and variability of a process. P-Charts: Measure how much of a process has output is composed of defective items. Np-Charts: Track the degree of variation of defects in a given sample. C-Charts: Coordinate the count of defects per unit. U-Charts: Use the count of defects per unit in situations where the sample size is different. Attribute Control Charts are one of the basic tools of statistical process control that is used to monitor processes that deal with non-measurable data such as the number of defects in a unit or a batch. These charts help in identifying variations and maintaining process quality by setting control limits to detect unusual variations [9][10]. Types of Attribute Control Charts [11]-[13] include P-Chart (Proportion Chart): - and NP-Chart (Number of Defectives Chart): Monitor the number of defective items in a fixed sample size. Useful for consistent sample sizes. C-Chart (Count of Defects Chart): Tracks the number of defects per unit in a constant sample size. U-Chart (Defects per Unit Chart): Monitors the number of defects per unit with varying sample sizes.
The purpose of this paper is to use the triangular membership function and the product's constant simple size to apply both fuzzy and crisp control charts to real data. The recommended ranking technique is then utilized to determine the attribute quality control when ( ), (
), ( ) are applied. This document is organized as follows. In Section 2, the design of control charts and their mathematical representation are exhibited. In part 3, they provided examples of how to create and use numbers. The dissociation and outcomes are presented in Section 4. Conclusions are given in Section 5.
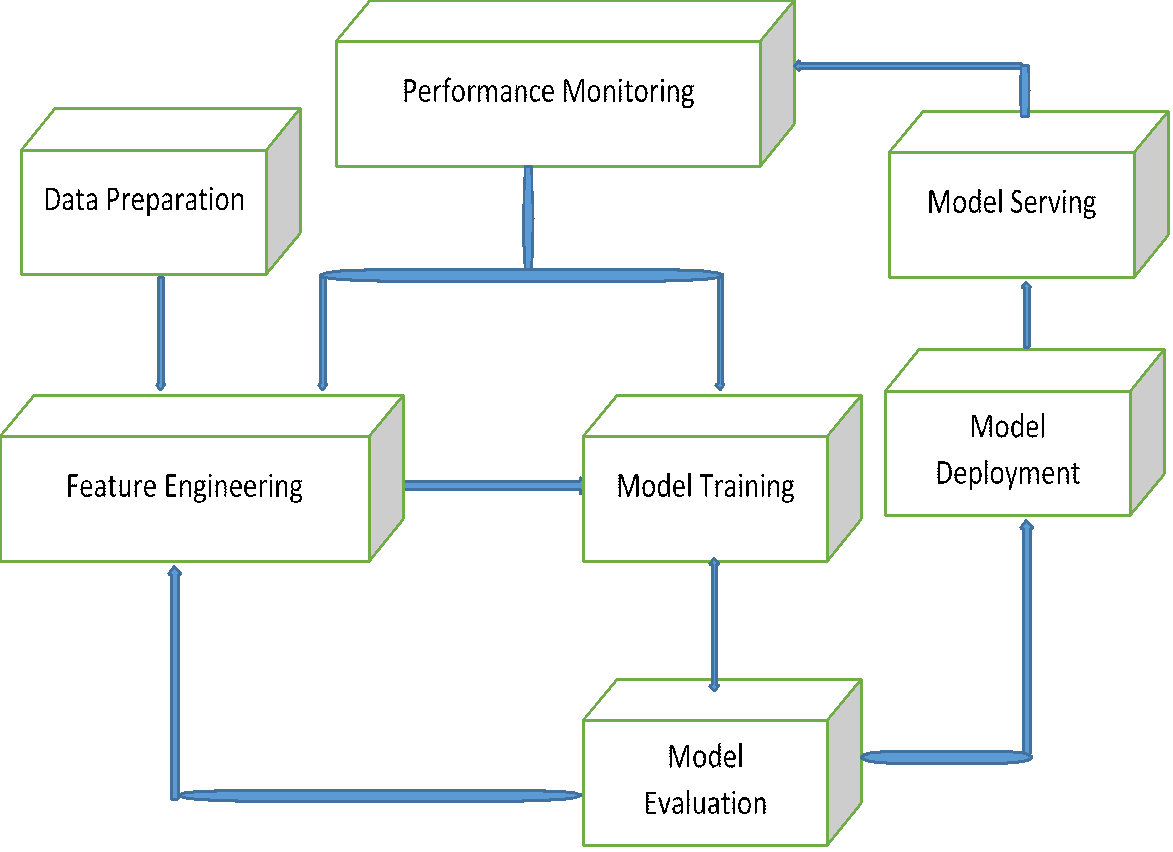
This paragraph includes three stages: Stage 1 - the current method represented by a p-chart, Stage 2 - the proposed method represented by a fuzzy p-chart through an extension that improves the gaps in the current knowledge system, and Stage 3 - represented by production sample training models for numerical implementation through experimental setup, data collection, ethical considerations, and performance metrics can be seen in Fig. 1.
The steps for calculating a p-chart are as follows [14]-[16]:
| (1) |
compute the average proportion (p̄): The average proportion of nonconforming items is calculated as:
| (2) |
where k is the number of samples.
| (3) |
| (4) |
These control limits represent the expected variation in the sample proportions due to common causes. Construct the p-chart: Plot the sample proportions (p) on the y-axis and the sample number or time on the x-axis. Include the centerline (p̄) and the upper and lower control limits. Interpret the p-chart: Analyze the p-chart to identify any points outside the control limits or any patterns or trends in the data, which may indicate the presence of special causes of variation. By following these steps, organizations can effectively monitor the proportion of nonconforming items in their production processes, identify potential issues, and take corrective actions to improve quality and reduce waste.
Fuzzy logic is one of the type of logic that is used in some of the expert systems as well as in artificial intelligence. This type of logic was devised in 1965 by the Azerbaijani scientist Lutfi Zadeh from the University of California where he developed to use it as a superior means of processing data but his theory was not recognized until 1974 when Fuzzy logic was used to control a steam engine [17]. Then its applications evolved until it arrived at the manufacture of fuzzy logic chips which were utilized in many products like photography machines [18]. Fuzzy logic is a form of many-valued logic that has been developed based on fuzzy set theory that deals with the issue of partial truth, where the truth value is between fully true and fully false. Fuzzy logic was initiated in 1965 by Lotfi A. Zadeh to develop the method of managing the vagueness inherent in real-life problems and to offer a mathematical method for handling imprecise and ambiguous data. At its core, fuzzy logic extends classical binary logic, which deals with clear distinctions (true or false), by incorporating degrees of truth. In a proposition of classical logic, it is either true or false but in fuzzy logic, the proposition’s truth can have a value between 0 and 1 [17]- [19]. This range shows the level of truthfulness of a proposition. For example, in the case of temperature, instead of having “hot” and “cold” categories, one is able to use “warmth” with a range of different levels of fuzziness [20]-[22].
Fuzzy Sets and Membership Functions, the fuzzy sets are a part of fuzzy logic that uses membership functions to define an element’s membership in the set. This function partitions its domain into two, assigning to each element a value between 0 and 1, thus, the degree of membership. For instance, the membership function of the fuzzy set of ‘tall people’ may give a value of 0.8 considering the proportion to someone who is 6 feet tall; this is likely to be a highly ‘membered’ circle [23][24].
Types of Fuzzy Functions, Fuzzy functions are mathematical functions that are used in an attempt to model systems that inherently contain uncertainty and imprecision. They are important in different applications such as control systems, decision-making, and artificial intelligence. Fuzzy functions are classified according to the structure and the use of the function in question. In this paper, we present several important kinds of fuzzy functions [25][26]:
Type-1 fuzzy functions are the simplest form of fuzzy functions that are available. They employ type-1 fuzzy sets in which the degree of membership of an element is a value between 0 and 1. These functions are applicable for cases where uncertainty is not a great factor or it can be measured with a great degree of accuracy [26][27].
Type-2 fuzzy functions are defined as an extension of the type-1 fuzzy functions by increasing the second degree of uncertainty. In these functions, for instance, the membership value is a fuzzy set that offers a better way of modeling uncertainty. They are particularly helpful in settings characterized by a large degree of uncertainty and fluctuation [28][29].
Fuzzy control charts are used to control the fuzziness that is always present when dealing with real-life processes. These charts allow for the incorporation of linguistic terms and fuzzy sets, making them suitable for processes where data is not crisp or precise [30]. Fuzzy control charts apply fuzzy logic principles to address imprecision and uncertainty in quality control data. These charts use fuzzy sets to represent data points, allowing for a more flexible approach to monitoring process behavior [31]. The fuzzy control is considered faster and more accurate through the results of the control scheme, which can show the defective sample during its production and identify the error in order to treat it as quickly as possible and avoid it in subsequent samples. An appropriate design must be provided for the fuzzy statistical control schemes within working limits that suit the samples to be produced. Rules are set within patterns that show the possibilities of changes and by adopting the solution by developing these schemes by adopting artificial intelligence such as fuzzy logic and a neural network to monitor and improve the quality of production [32]-[34]. Several simulations have been conducted that aim to raise the level of production quality by adopting monitoring schemes and controlling them by adopting samples of clear and fuzzy real data. The control depends on an order function that can be suggested between zero and one, such as ( ).
).
Fuzzy p-charts have been used to monitor the quality of healthcare services, accommodating the imprecision and variability inherent in medical data [14]. Fuzzy p-charts have improved the monitoring of production processes by providing more accurate control under uncertain conditions [35]. The application of fuzzy p-charts in service quality control has enabled better handling of customer feedback and service performance data, leading to improved service quality [36].
Fuzzy control charts and p-charts are tools used in statistical quality control (SQC) to monitor process behavior and maintain quality. Although p-charts are applied to attribute data to examine the percentage of defective products, the fuzzy control charts utilize fuzzy logic to manage vagueness and ambiguity [37]. This review examines research that combines fuzzy control charts with p-charts with the objective of understanding the advantages of such a dual system. A new approach that has evolved from the integration of fuzzy logic with conventional p-charts is considered a key research issue in the field of statistical quality control (SQC). Fuzzy control charts help in dealing with the vagueness and imprecision that are always typical of real-life quality control situations [38]. The incorporation of fuzzy logic into p-charts improves their uncertainty management in quality control processes. This approach is particularly effective in that context because variability and uncertainty of data are high there [39].
If one or more of the defective proportions fall outside of the upper and lower control limits, the production process is said to be outside of its control limit. The way the production process is run is different. Equation (5) and equation (6) make use of the Ranking function and the Fuzzy set. It is necessary to specify a clear sample group before utilizing a fuzzy group to express it in order to apply fuzzy logic. The connection in the address of the group consists of ordered pairs. Membership is the name of another group. A represents the obscure or fuzzy, while X represents the clear, which can be stated by both groups. Accordingly, the function can be expressed as follows: [40][41] where fuzzy logic is used to write the membership of the fuzzy group.
| (5) |
Fuzzy logic can be used to represent the fuzzy sums. Trigone takes up their ideals and demonstrates them with  , which can be included in the following equation:
| (6) |
The first is the production, which was shown to be flawed for every sample the data came from one of the major producers, the blower motor in an electric hair dryer for the motor department, the state firm responsible for producing. As indicated in Table 1, the constant sample size was 300 for (25) days, chosen to identify the rejected goods.
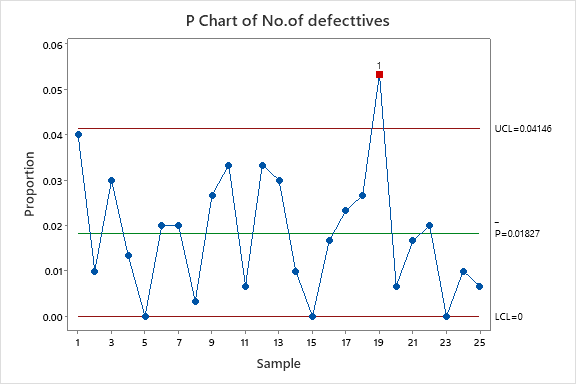
Using attribute control charts for each sample in Table 1, find (p) first, which indicates in Equation no.1 the percentage of defective samples for each sample in Table 2. Additionally, in the second phase, determine the control limits indicated by equation no. (2) to equation (4). Using Minitab (21) software, as illustrated in Fig. 2, draw the quality control charts based on the attributes control charts. As an example, sample one is:
|
|
|
|
N | No. of defectives | Sample size |
1 | 12 | 300 |
2 | 3 | 300 |
3 | 9 | 300 |
4 | 4 | 300 |
5 | 0 | 300 |
6 | 6 | 300 |
7 | 6 | 300 |
8 | 1 | 300 |
9 | 8 | 300 |
10 | 11 | 300 |
11 | 2 | 300 |
12 | 10 | 300 |
13 | 9 | 300 |
14 | 3 | 300 |
15 | 0 | 300 |
16 | 5 | 300 |
17 | 7 | 300 |
18 | 8 | 300 |
19 | 16 | 300 |
20 | 2 | 300 |
21 | 5 | 300 |
22 | 6 | 300 |
23 | 0 | 300 |
24 | 3 | 300 |
25 | 2 | 300 |
N | P |
1 | 0.040 |
2 | 0.010 |
3 | 0.030 |
4 | 0.013 |
5 | 0.000 |
6 | 0.020 |
7 | 0.020 |
8 | 0.0003 |
9 | 0.027 |
10 | 0.037 |
11 | 0.0007 |
12 | 0.033 |
13 | 0.030 |
14 | 0.010 |
15 | 0.000 |
16 | 0.017 |
17 | 0.023 |
18 | 0.027 |
19 | 0.053 |
20 | 0.007 |
21 | 0.017 |
22 | 0.002 |
23 | 0.000 |
24 | 0.010 |
25 | 0.007 |
Using (5) and considering that  [43], as shown in Table 3. By giving the values of the w, λ where they fall between zero and one,
  , fuzzy numbers can be generated. Three cases were selected for the current work, and they included the following: Let's now compute a new ranking function using
  and
and  . Next, determine the ranking function using equation (6).
Attributes control charts are now applied to all samples when  and
and  . First, as indicated in Table 4, determine (p) in equation (1).
|
Next, find the attribute control's middle limit using equation (2).
|

N | Defective |
1 | 4.800 |
2 | 1.200 |
3 | 3.600 |
4 | 1.600 |
5 | 0.000 |
6 | 2.400 |
7 | 2.400 |
8 | 0.400 |
9 | 3.200 |
10 | 4.400 |
11 | 0.800 |
12 | 4.000 |
13 | 3.600 |
14 | 1.200 |
15 | 0.000 |
16 | 2.000 |
17 | 2.800 |
18 | 3.200 |
19 | 6.400 |
20 | 0.800 |
21 | 2.000 |
22 | 2.400 |
23 | 0.000 |
24 | 1.200 |
25 | 0.800 |

N | Defective |
1 | 0.016 |
2 | 0.004 |
3 | 0.012 |
4 | 0.005 |
5 | 0.000 |
6 | 0.008 |
7 | 0.008 |
8 | 0.001 |
9 | 0.010 |
10 | 0.014 |
11 | 0.002 |
12 | 0.013 |
13 | 0.012 |
14 | 0.004 |
15 | 0.000 |
16 | 0.006 |
17 | 0.009 |
18 | 0.010 |
19 | 0.021 |
20 | 0.002 |
21 | 0.006 |
22 | 0.008 |
23 | 0.000 |
24 | 0.004 |
25 | 0.002 |
Next, use the equation to get the upper bound of attribute control (3).
|
Determine the attribute control's lower bound using equation (4).
|
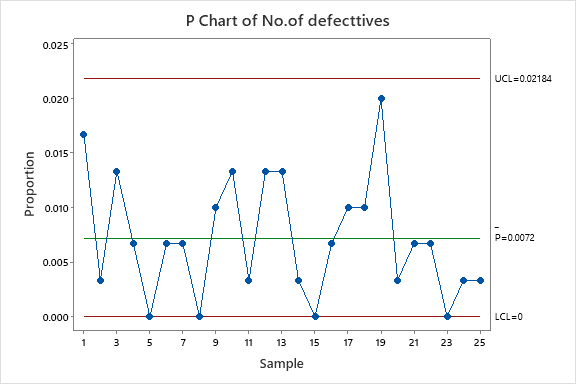
Lastly, as seen in Fig. 3, the quality control charts rely on the characteristics control charts below:
Using the values of w and  to compute a new ranking function,
 , Next, as indicated in Table 5, determine the ranking function by utilizing equation (5).

N | Defective |
1 | 9.600 |
2 | 2.400 |
3 | 7.200 |
4 | 3.200 |
5 | 0.000 |
6 | 4.800 |
7 | 4.800 |
8 | 0.800 |
9 | 6.400 |
10 | 8.800 |
11 | 1.600 |
12 | 8.000 |
13 | 7.200 |
14 | 2.400 |
15 | 0.000 |
16 | 4.000 |
17 | 5.600 |
18 | 6.400 |
19 | 12.800 |
20 | 1.600 |
21 | 4.000 |
22 | 4.800 |
23 | 0.000 |
24 | 2.400 |
25 | 1.600 |
By using characteristics control charts for all samples with and . First, as shown in Table 6, find (p) in equation (1).
|
Next, find the attribute control's middle limit using equation (2).
|
Next, use the equation to get the upper bound of attribute control (3).
|
Determine the attribute control's lower bound using equation (4).
|
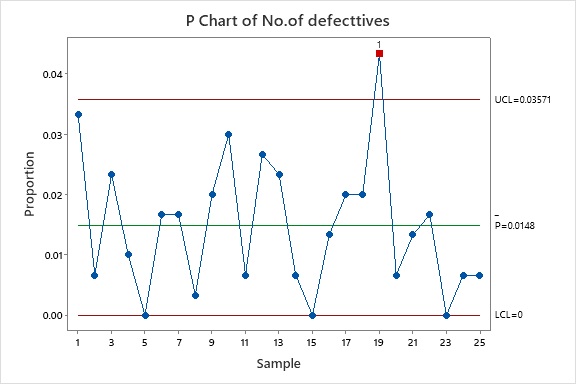
Lastly, as seen in Fig. 4, the quality control charts rely on the characteristics control charts (3).
N | Defective |
1 | 0.032 |
2 | 0.008 |
3 | 0.024 |
4 | 0.010 |
5 | 0.000 |
6 | 0.016 |
7 | 0.016 |
8 | 0.002 |
9 | 0.021 |
10 | 0.029 |
11 | 0.005 |
12 | 0.026 |
13 | 0.024 |
14 | 0.008 |
15 | 0.000 |
16 | 0.013 |
17 | 0.018 |
18 | 0.021 |
19 | 0.042 |
20 | 0.005 |
21 | 0.013 |
22 | 0.016 |
23 | 0.000 |
24 | 0.008 |
25 | 0.005 |

After carrying out the required computations and producing the traditional and fuzzy P-chart and fuzzy chart for 25 samples of an industrial product (the blower motor in an electric hair dryer for the motor department), the following results are obtained using the Minitab 21 Statistical Software:
The limit values of the faulty proportions P- chart, as shown in Fig. 2. The sample (19) outputs the upper control limit, where the lower control limit is 0.000, the center limit is 0.018, and the upper control limit is 0.014. Fig. 3 displays the control limit values of the Fuzzy Chart for  and
and  . The samples within control limits (between the upper control limit and lower control limit), have the following values: Upper Control Limit = 0.024, Center Limit = 0.0074, Lower Control Limit = 0.00. Fig. 4 displays the values of the fuzzy chart's control limits when
  and
and  . The samples were within control limits (between the upper control limit and lower control limit). The lower control limit is 0.000, the center limit is 0.0148, and the upper limit is 0.03571.
We found that the fuzzy control chart was better than the traditional P-chart in identifying quality changes while the sample size remained constant. Because it considers all product levels, not just those that are accepted or not. Consequently, in order to accurately divide the product into levels based on specialists and monitor quality, we must consider this type of control chart, From the drawing of the charts, it is clear that the proposed method can be used to improve production due to its ability to reduce the rate of defective samples.
By conducting the necessary tests, representing the samples with drawings, and making the necessary improvements, which required the use of traditional and expert fuzzy drawings, it became clear that it was possible to verify: Possibility to determine the percentage of defective samples for each sample at the beginning of recruitment using the attribute quality control chart. The possibility of utilizing the triangle membership function to determine the approximate number of defects for each sample. Verify the possibility of applying the recommended classification function three times for each sample to obtain the ambiguous number: ( ) the first time, (
 ) the second time. Possibility of determining the percentage of faulty samples in all samples using fuzzy quality control. In order to verify the effectiveness of the proposed method, all production samples were compared between traditional and fuzzy control charts, and the results showed that the fuzzy control charts are more accurate and provide the possibility of managing production quality more quickly and accurately. It is possible to say that the construction of control charts Fuzzing has more flexibility, is more suitable to the concept of mathematical description, and has more reasonable results than traditional qualitative control schemes. This leads to the detection of defective units at every stage of the production process, which helps in identifying errors in a timely manner. Data analysis showed that more accurate and practical results were obtained using control charts based on fuzzy sets. Fuzzy control charts, which are produced using fuzzy set theory, depict uncertainty more accurately than Shewhart control charts.
Salman Hussien Omran, Comparative Traditional Methods of Attributes with Fuzzy Quality Control Charts for Improving the Quality of a Product