Control Systems and Optimization Letters, Vol. 1, No 2, 2022 |
Design and Testing of Electrosurgery Unit
Meilia Safitri 1,*, Adrian Pranata 2, Muhammad Irfan 3, Muhammad Hamka Ibrahim 4
1,2 Department of Electrical Medic, Vocational College, Universitas Muhammadiyah Yogyakarta, Yogyakarta, Indonesia
3 PKU Muhammadiyah Hospital, Gamping, Yogyakarta, Indonesia
4 Department of Electrical Engineering, Universitas Sebelas Maret, Surakarta, Indonesia
4 Graduate School of Science and Engineering, Chiba University, Japan
Email: 1 meilia.safitri@vokasi.umy.ac.id, 2 adrian.pranata.vok18@mail.umy.ac.id, 3 dakwahbadko@gmail.com,
*Corresponding Author
Abstract— Bleeding during surgery is common in major surgical operations. So, it is not recommended to make an incision using a conventional scalpel. As an alternative to replacing a conventional scalpel, an electric scalpel or know as electrosurgery unit (ESU) is made by utilizing a high frequency whose duty cycle can be adjusted and then being focused on one point is a solution to prevent bleeding. This research will design a bipolar electric scalpel or bipolar electrosurgical unit with a frequency of 210-250 KHz and an input voltage of 50-90 VDC to perform pure cuts on chicken meat samples. The box pulse frequency will be generated from IC 4069. The output of the oscillator generator will read the high and low voltage on the Arduino Nano digital pin. The current will be amplified at the oscillator output and then processed in the inverter driver circuit. The selection of the DC input voltage will use a voltage driver circuit. The inverter driver output and voltage driver will be step-up to get a maximum power. Of 10.4W with a resistance of 100Ω at a frequency setting of 210 KHz and an input voltage of 90 VDC and a minimum power of 1.4W with a resistance of 100Ω at a frequency setting of 250 KHz and input voltage 50 VDC.
Keywords— power system, control, state feedback
Bleeding during surgery is common in major surgical operations. Therefore, it is not recommended to make an incision using a conventional scalpel. As an alternative to replace conventional scalpels, an electric scalpel or known as Electrosurgery Unit (ESU), is made by utilizing a high frequency whose duty cycle can be adjusted and then focused on one point [1]. This method is the best way to prevent bleeding. The Electrosurgery Unit takes advantage of the heat effect generated by high frequencies which are concentrated at one point so that they can be used for surgical procedures and cutting of body tissues to minimize the occurrence of a lot of blood loss. Although the scalpel will never entirely be replaced by electrosurgery, it does require expertise, knowledge, and a thorough grasp of the biophysical features and interactions between energy and electrosurgical tissue [2]-[3].
When performing surgery using an electric scalpel, the fumes produced contain hazardous chemicals (for example, hydrogen cyanide, acetylene, and butadiene). Apart from chemicals, bacteria and viruses can also be transmitted through this smoke [4]. The design of a low power electric scalpel is one of the many studies conducted to prevent faradic effects and spark over. According to [5]-[6], at frequency above 300 kHz, the faradic effects can be neglected.
Electrosurgery, also known as radiosurgery, has been used in dentistry for more than 50 years. Electrosurgery is the precisely controlled application of a radiofrequency electric current to the soft tissue part to be cut, achieved through carefully designed electrodes [7]. Testing and calibration of electrosurgical units using an electrosurgical analyzer aims to obtain information about procedures for testing and calibration of electrosurgical units and to find out whether the device is feasible or not when operated on patients. Moreover, it used to find out the calibration results data based on electrosurgical testing and calibration procedures unit provided that the output of the electrosurgical unit is within the threshold (±10% for cutting settings and coagulation settings).
The two operational ESU modes are bipolar and monopolar, respectively. One of the most frequently used surgical tools, bipolar electrosurgery is employed in all surgical specialties [8]-[9]. This mode employs certain other tools, such forceps, to pass the current through because it runs at lower voltages, requiring less energy [10]. Due to its restricted ability to exercise and coagulate broad bleeding areas, this offers better control over the targeted location and aids in preventing harm to adjacent delicate tissues [11]. It works best when utilized during procedures where tissue removal with forceps electrodes is simple [12]. Cutting and freezing are the two main categories of currents, and there are numerous types of combined or pulsed currents that enable varied tissue effects [13]. A frequency wave with a 100% active-duty cycle is employed for cutting since it generates heat quickly [14]. In contrast, only approximately 6% of coagulation (freezing) uses an active duty-cycle wave [15].
Author in [1], design of a monopolar electric scalpel using the CMOS 4069 IC as a generator, the output frequency is set at 300 KHz, then it is forwarded to the pulse control circuit and controlled with the ATmega328 IC. Then it is forwarded to the inverter circuit which functions to increase the voltage and output in the form of power. The module has LOW, MEDIUM, HIGH features. The use of 300 KHz frequency with low power for monopolar surgery is not optimal to get a deeper incision depth. Then the input voltage needs to be increased again to 180 VDC.
The design of a bipolar electric scalpel utilizes a high frequency of 400 KHz which is regulated with a duty cycle of 100% on and two pulse cutting and coagulation mode is proposed by [16]. The lowest power, 32.3 Watts, and the largest power mode, 58.3 Watts. The smoke absorber for this suggested system is still missing, though.
Based on the weaknesses and shortcomings in previous studies, the aim of this research is to make a Pure Cut Mode Bipolar Electrosurgical Unit with 5 selectors for frequency range 210 - 250 KHz and 4 selectors for selection for voltage range 50 VDC-90 VDC. The module is also equipped with a smoke absorber with a suction power of 6000Pa. The frequency and power selection will be displayed on an LCD using the Arduino nano as the controller.
The proposed Bipolar Unit Electrosurgical flowchart can be seen in Fig.1 It can be explained that when the device is turned on, initialization occurs, the power supply and the minimum system circuit are active so that the frequency and voltage values will be displayed on the LCD if the frequency and voltage selection has been made. Once selected, the cutting process can be carried out by pressing the footswitch. When the footswitch is pressed the inverter driver will be active, the cutting process can be done. At the same time the buzzer indicator sounds, and the smoke absorber will inhale the smoke generated from the cutting.
Hardware design is carried out as a procedure for determining programs that will be included in the minimum system that functions as a hardware controller. The hardware used to manufacture the Electrosurgical Unit Bipolar (Pure Cutout Mode) device is a minimum system circuit, oscillator circuit, inverter driver circuit, and power supply circuit.
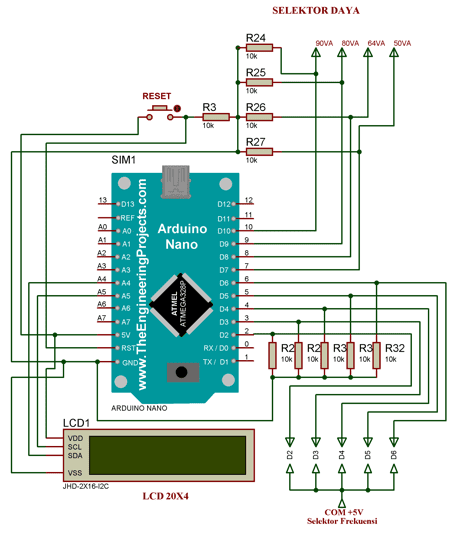
The minimum system circuit functions to read the frequency and voltage used. The value will be displayed on the LCD which is processed by the Arduino Nano. This circuit uses pulldown resistors on pins D2-D6 which function to read the value of the frequency used. Pins D7-D10 are used to read voltage values. Pulldown resistors are used to keep the pin in a no-voltage state, or to avoid floating voltages. The use of pulldown resistors is also used on the RST pin with the same function as pins D2-D10. To activate the LCD, 4 pins are used on the Arduino, namely the 5V pin is connected to the VDD (+) pin, the SCL pin is connected to pin A5, the SDA pin is connected to pin A4 and the VSS pin is connected to the GND pin. The minimum system circuit can be seen in Fig. 1.
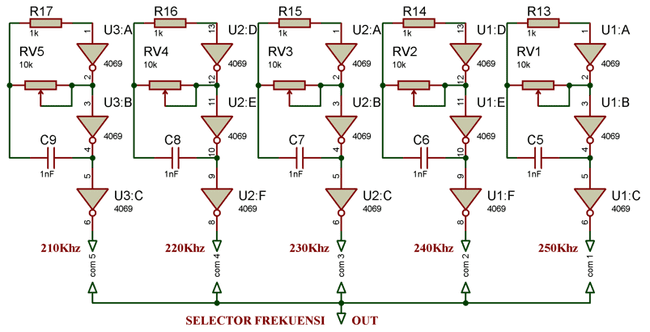
This oscillator circuit functions to produce high frequencies in the range of 210 - 250 Khz which can be selected using a 2 pole 6 position selector. This circuit uses CD4069UBE CMOS IC components, 1 nF MKM Capacitor, 1 kΩ Resistor and 10 KΩ Multiturn. The way the oscillator circuit works in this system is that at the start conditions 3 and 11 are logic "0" then the output is logic "1", so that the capacitor charges up. At the output there will be an increase in voltage due to charging the capacitor. Once fully charged, the capacitor then discharges its charge so that the voltage at the output drops to logic "0" and becomes input to gate 1. This event will continue to occur repeatedly until it produces high and low pulses to form square pulses. The oscillator circuit can be seen in Fig. 2.
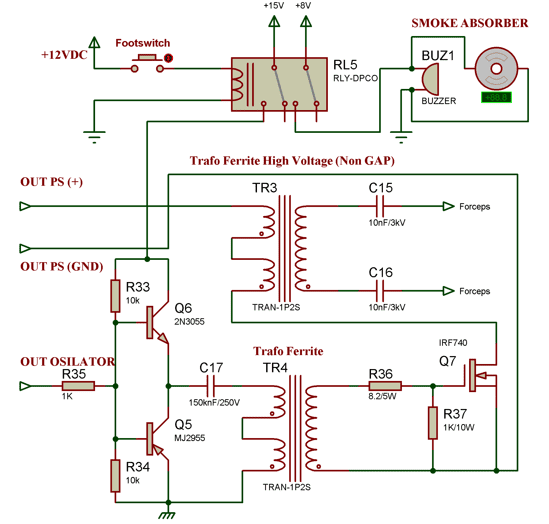
The inverter driver functions to convert DC current into AC current while maintaining high frequencies above 210 KHz. The inverter driver will provide a trigger for the MOSFET gate in the output circuit. The driver consists of PNP and NPN transistors and a transformer as shown in Fig. 3. Resistors R33, R34 and R35 are voltage divider resistors which function to bias the bases of transistors Q5 and Q6. When the pulse control signal is high, Q5 will be in saturation, while Q5 will be cut off. Current flows from Vcc to collector Q5, emitter and charges capacitor C17. The voltage across capacitor C17 then rises. When fully charged, the capacitor voltage will stabilize for a moment. Then the signal from the pulse regulator drops to a logic low. Q5 is cut off and Q6 is in saturation. The capacitor then discharges through Q6 then to ground. The capacitor voltage then decreases. Then the signal from the pulse regulator rises to a logic high. Q5 again conducts and causes the capacitor to charge. The capacitor voltage rises again until it is full. This event will occur continuously.
The voltage passing through capacitor C17 will induce the first step-up ferrite transformer, the goal is for the voltage to rise to ±80 VPP and the current to drop in order to open the MOSFET gate. Voltage divider resistors are used at the output of the transformer, namely at R36 and R37 so that the voltage drops below 30 VPP according to the maximum limit of the IRF740 MOSFET specifications. At the gate the incoming voltage must be above 10 VPP so that the drain and source saturation. When the footswitch is connected, the main power supply output from the power driver will flow to the second step-up ferrite transformer then the current and voltage through the drain leg to the source. The second step-up ferrite transformer will increase the voltage by ± 300 VPP-700VPP. The transformer output will be filtered using varistors on C15 and C16. At the same time, the buzzer and smoke absorber are active when the footswitch is high. The buzzer functions as an indicator that a cutting process is taking place because the inverter driver is active. The smoke absorber works to suck in the smoke from the incision with a suction power of 6000 Pa.
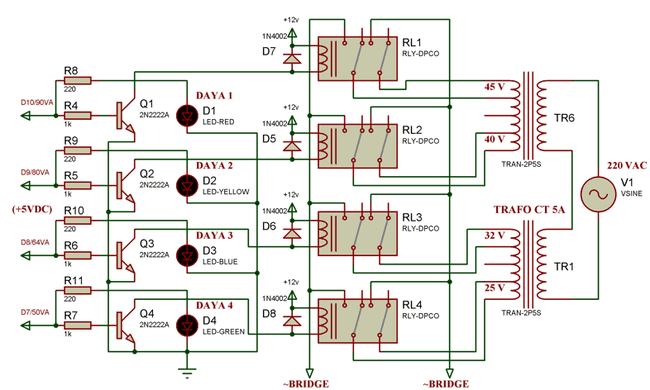
The Voltage Driver circuit is a circuit that functions to select the amount of voltage used starting from 50-90 VAC. This circuit uses a 2 pole 6 position selector to open the transistor gate and read a high or low voltage which will be forwarded to the Arduino input. The selector is used to select the voltage to get varying power. The 2 pole 6 position selector is used to open the base gate on the transistor Q1-Q4 alternately and at the same time also provides a high or low voltage on the Arduino pin to read the voltage value that will be displayed on the LCD. The function of R4-R7 is to reduce the voltage below 0.7 VDC so that the saturation value is obtained at the base leg. After the base of the transistor is saturated, voltage and current will flow from collector to emitter until the relay is active and the relay coil produces a magnetic field. Resistors R8-R11 are used to lower the voltage and current so that the LED can work as an active relay indicator. When the relay coil generates a magnetic field, the iron in the NC will be attracted to the NO position. To avoid backflow caused by a magnetic field in the relay coil, a silicon diode is used which is mounted on the foot of the relay coil in reverse bias. The voltage at NO will flow to the bridge diode input which will then be converted into DC current using a power supply circuit. The voltage driver circuit can be seen in Fig. 4.
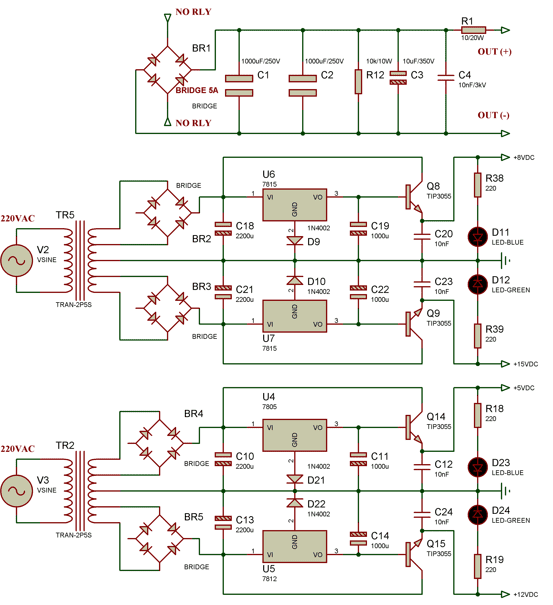
The Power Supply circuit is a circuit that converts AC current into DC current which is used to supply voltage and current to the oscillator circuit, minimum system, voltage driver and inverter driver so that it can be activated.
There are two types, namely the power supply to activate the second step-up ferrite transformer and the power supply to activate the oscillator, minimum system, and inverter driver. Its circuit is shown in Fig. 5. The main power supply uses a 5A transformer, the voltage to be changed is from 50-90 VAC. Because the main power supply wants to get pure voltage and current, a 6A diode bridge is used, 2 capacitors C1 and C2 with a value of 1000uF/250V as the main filter. R12 functions with a rated resistance of 10kΩ/10W for a current reducing filter. Capacitor C3 rated at 10uF/400V is used for the next filter to reduce the ripple in the DC wave. Then capacitor C4 with a value of 10nF/3kV is used as a safety if the main power supply current collides with the current generated from the inverter driver. To reduce overheating in the inverter circuit, R1 with a value of 20Ω/20W at the output of the main power supply is used to reduce the current that will flow to the drain-source leg of the MOSFET.
The power supply to activate the oscillator circuit uses +15 VDC, +5 VDC for minimum system circuit, +15 VDC for inverter driver circuit, +12 VDC for footswitch relay, buzzer and +8 VDC smoke absorber. For this power supply, a 2A transformer is used for the minimum system, 3A for the oscillator and inverter driver, and 5A for the buzzer and smoke absorber.
Frequency measurements at the oscillator output will be carried out at pin 6 output point of the CMOS 4069 UBE IC. Measurements were carried out 10 times with a frequency setting of 210 - 250 KHz. Measurements are made at intervals of 10 seconds. Based on the data in Table 1, for each frequency measurement at 210-250 KHz, the measurement results using an oscilloscope are quite good when viewed from each percentage of error value and remain constant for 10 measurements because it is close to the setting value but is less stable. This is due to the factor of charging and discharging the capacitor on the IC oscillator and setting the frequency limit so that it affects the stability of the measurement.
Number | Frequency setting (kHz) | ||||
210 | 220 | 230 | 240 | 250 | |
1 | 210.6 | 221.4 | 230.7 | 240.2 | 250.3 |
2 | 210.8 | 220.6 | 231.1 | 239.9 | 249.8 |
3 | 211.2 | 221.2 | 229.8 | 240.7 | 251.4 |
4 | 209.9 | 220.9 | 230.4 | 240.5 | 250.4 |
5 | 209.7 | 221.9 | 230.9 | 239.7 | 250.5 |
6 | 210.4 | 220.5 | 229.9 | 240.1 | 249.8 |
7 | 210.7 | 219.9 | 230.2 | 240.3 | 250.1 |
8 | 209.9 | 220.9 | 231.7 | 239.7 | 251.6 |
9 | 210.2 | 221.2 | 230.4 | 239.8 | 250.8 |
10 | 210.8 | 220.6 | 230.1 | 241.2 | 251.4 |
Mean | 210.42 | 220.91 | 230.52 | 240.20 | 250.61 |
% Error | -0.20 | -0.413 | -0.226 | -0.087 | -0.244 |
Number | Frequency setting (kHz) | ||||
210 | 220 | 230 | 240 | 250 | |
1 | 212.2 | 221.7 | 231.5 | 241.4 | 250.9 |
2 | 211.6 | 222.1 | 232.1 | 239.6 | 250.3 |
3 | 210.8 | 219.9 | 230.4 | 242.5 | 250.5 |
4 | 209.9 | 219.7 | 229.8 | 239.9 | 250.1 |
5 | 210.7 | 220.5 | 229.6 | 240.7 | 251.6 |
6 | 210.8 | 222.2 | 230.9 | 241.1 | 251.8 |
7 | 211.9 | 221.4 | 231.4 | 241.6 | 250.8 |
8 | 210.6 | 220.6 | 230.8 | 240.1 | 250.2 |
9 | 210.2 | 220.1 | 230.1 | 240.3 | 249.6 |
10 | 210.4 | 220.3 | 231.7 | 240.6 | 250.0 |
Mean | 210.98 | 220.91 | 230.73 | 240.80 | 250.64 |
% Error | -0.470 | -4.414 | -0.318 | -0.333 | -0.257 |
Frequency measurements at the inverter driver output will be carried out at the gate and source leg input points on the IRF740 MOSFET. Measurements were carried out 10 times with a frequency setting of 210-250 KHz. Measurements are made at intervals of 10 seconds. Based on the data in Table 2, for each frequency measurement at a setting of 210-250 KHz the measurement results using an oscilloscope are quite good when viewed from each percentage of error value and remain constant for 10 measurements. The frequency that is passed through the first step-up ferrite transformer can maintain the set frequency value without any drastic reduction or addition. This happens because the frequency that passes through the first step-up ferrite transformer is amplified by the current using NPN and PNP transistors so that it can induce the ferrite transformer so that the voltage and current are sufficient to open the MOSFET gate.
The power measurement at the final step-up output will be measured using an Electrosurgical Unit Analyzer with a 100Ω resistance. The amount of power generated will be measured 10 times. Measurements were made at settings of 210-250 KHz with each input voltage of 50-90 VDC. Measurements are made by activating the electrodes for 15 seconds so that the power measurement can be stable. Based on Table 3, for a frequency of 210 KHz the results of the power measurement from the input voltage setting are 50-90 VDC. The highest uncertainty value is at the input voltage setting of 80 VDC.
Number | Power output (W) | |||
50 VDC | 64 VDC | 80 VDC | 90 VDC | |
1 | 4.9 | 6.7 | 8.6 | 10.4 |
2 | 4.8 | 6.7 | 8.7 | 10.4 |
3 | 4.9 | 6.8 | 8.6 | 10.5 |
4 | 4.9 | 6.7 | 6.6 | 10.4 |
5 | 4.9 | 6.7 | 8.7 | 10.5 |
6 | 4.8 | 6.8 | 8.6 | 10.5 |
7 | 4.9 | 6.7 | 8.6 | 10.4 |
8 | 4.9 | 6.7 | 8.7 | 10.4 |
9 | 4.8 | 6.8 | 8.7 | 10.4 |
10 | 4.9 | 6.7 | 8.6 | 10.4 |
Mean | 4.87 | 6.73 | 8.74 | 100.43 |
SD | 0.048 | 0.015 | 0.051 | 0.048 |
Based on Table 4 for a frequency of 220 KHz the results of power measurements from the input voltage setting are 50-90 VDC. The highest uncertainty value is at the input voltage setting of 80 VDC. From the standard deviation value, some of the measurement numbers are close to the average value of the measurement results. Based on Table 5, for a frequency of 230 KHz the results of the power measurement from the input voltage setting are 50-90 VDC. The highest uncertainty values are in the input voltage settings of 50, 64 and 90 VDC.
Number | Power output (W) | |||
50 VDC | 64 VDC | 80 VDC | 90 VDC | |
1 | 4 | 5.3 | 7.7 | 8.3 |
2 | 4 | 5.3 | 7.6 | 8.2 |
3 | 4 | 5.3 | 7.7 | 8.3 |
4 | 4.1 | 5.2 | 7.7 | 8.3 |
5 | 4 | 5.3 | 7.6 | 8.2 |
6 | 4 | 5.2 | 7.7 | 8.3 |
7 | 4 | 5.3 | 7.7 | 8.2 |
8 | 4.1 | 5.3 | 7.7 | 8.3 |
9 | 4 | 5.2 | 7.6 | 8.3 |
10 | 4 | 5.3 | 7.6 | 8.3 |
Mean | 4.02 | 5.27 | 7.66 | 8.27 |
SD | 0.042 | 0.048 | 0.051 | 0.048 |
Based on Table 6, for a frequency of 240 KHz, the power measurement results from the input voltage setting are 50-90 VDC. The uncertainty value at the 240 KHz frequency setting is quite constant. From the standard deviation value, some of the measurement numbers are close to the average value of the measurement results. Based on Table 7, for a frequency of 250 KHz the results of the power measurement from the input voltage setting are 50-90 VDC. The highest uncertainty value is at the input voltage setting of 50 VDC.
Number | Power output (W) | |||
50 VDC | 64 VDC | 80 VDC | 90 VDC | |
1 | 3.1 | 4.4 | 5.7 | 6.3 |
2 | 3 | 4.4 | 5.6 | 6.3 |
3 | 3 | 4.4 | 5.6 | 6.4 |
4 | 3.1 | 4.5 | 5.7 | 6.3 |
5 | 3.1 | 4.4 | 5.7 | 6.4 |
6 | 3.1 | 4.5 | 5.7 | 6.4 |
7 | 3 | 4.4 | 5.7 | 6.4 |
8 | 3 | 4.4 | 5.6 | 6.3 |
9 | 3.1 | 4.5 | 5.7 | 6.3 |
10 | 3 | 4.5 | 5.7 | 6.4 |
Mean | 3.05 | 4.44 | 5.67 | 6.35 |
SD | 0.052 | 0.051 | 0.048 | 0.052 |
Number | Power output (W) | ||||
50 VDC | 64 VDC | 80 VDC | 90 VDC | ||
1 | 2.4 | 3.2 | 4 | 4.7 | |
2 | 2.5 | 3.2 | 4 | 4.6 | |
3 | 2.5 | 3.2 | 4.1 | 4.6 | |
4 | 2.4 | 3.3 | 4 | 4.6 | |
5 | 2.4 | 3.2 | 4 | 4.7 | |
6 | 2.4 | 3.2 | 4 | 4.7 | |
7 | 2.5 | 3.3 | 4.1 | 4.6 | |
8 | 2.5 | 3.3 | 4.1 | 4.6 | |
9 | 2.4 | 3.2 | 4.1 | 4.6 | |
10 | 2.5 | 3.3 | 4 | 4.7 | |
Mean | 2.45 | 3.24 | 4.04 | 4.64 | |
SD | 0.052 | 0.051 | 0.051 | 0.051 | |
Number | Power output (W) | |||
50 VDC | 64 VDC | 80 VDC | 90 VDC | |
1 | 1.4 | 1.8 | 2.2 | 2.5 |
2 | 1.4 | 1.8 | 2.2 | 2.5 |
3 | 1.5 | 1.8 | 2.2 | 2.5 |
4 | 1.5 | 1.7 | 2.2 | 2.5 |
5 | 1.4 | 1.8 | 2.1 | 2.4 |
6 | 1.4 | 1.8 | 2.1 | 2.5 |
7 | 1.5 | 1.7 | 2.2 | 2.5 |
8 | 1.5 | 1.7 | 2.2 | 2.5 |
9 | 1.4 | 1.8 | 2.1 | 2.4 |
10 | 1.4 | 1.8 | 2.2 | 2.5 |
Mean | 1.44 | 1.77 | 2.17 | 2.48 |
SD | 0.051 | 0.048 | 0.048 | 0.042 |
Measurement of the results of the sample cutting test on chicken meat will be measured using a digital caliper with an accuracy of one comma after the number. Sample cutting was carried out at a frequency setting of 210-250 KHz with an input voltage of 50-90 VDC. Sample cutting was carried out for 15 seconds until a well-measured incision was achieved.
Based on Table 8, for a frequency of 210 KHz the results of measuring the depth of the incision from the input voltage setting are 50-90 VDC. The highest uncertainty values are in the input voltage settings of 64 VDC and 90 VDC. From the standard deviation value, some of the measurement numbers are close to the average value of the measurement results. Based on Table 9, for a frequency of 220 KHz the results of measuring the depth of the incision from the input voltage setting are 50-90 VDC. The highest uncertainty value is at the input voltage setting of 50 VDC and 90 VDC.
Number | Cutting depth (mm) | ||||
50 VDC | 64 VDC | 80 VDC | 90 VDC | ||
1 | 2.2 | 4.3 | 5.6 | 6 | |
2 | 2.2 | 4.4 | 5.6 | 6.1 | |
3 | 2.2 | 4.3 | 5.6 | 6 | |
4 | 2.3 | 4.2 | 5.7 | 6 | |
5 | 2.2 | 4.3 | 5.7 | 6.1 | |
6 | 2.3 | 4.4 | 5.6 | 6 | |
7 | 2.2 | 4.3 | 5.5 | 6.1 | |
8 | 2.2 | 4.2 | 5.7 | 6.1 | |
9 | 2.3 | 4.3 | 5.6 | 6.2 | |
10 | 2.3 | 4.3 | 5.6 | 6.1 | |
Mean | 2.25 | 4.3 | 5.62 | 6.07 | |
SD | 0.052 | 0.066 | 0.063 | 0.067 | |
Number | Cutting depth (mm) | ||||
50 VDC | 64 VDC | 80 VDC | 90 VDC | ||
1 | 2.1 | 4 | 5.2 | 5.8 | |
2 | 2.2 | 4 | 5.2 | 5.8 | |
3 | 2 | 4.1 | 5.3 | 6 | |
4 | 2.1 | 4.1 | 5.1 | 5.7 | |
5 | 2 | 4.2 | 5.1 | 5.8 | |
6 | 2 | 4.1 | 5.1 | 5.8 | |
7 | 2.2 | 4 | 5.3 | 5.7 | |
8 | 2.1 | 4 | 5.1 | 5.6 | |
9 | 2.1 | 4 | 5.2 | 5.7 | |
10 | 2.2 | 4.1 | 5.2 | 5.8 | |
Mean | 2.10 | 4.06 | 5.18 | 5.77 | |
SD | 0.081 | 0.069 | 0.078 | 0.105 | |
Number | Cutting depth (mm) | ||||
50 VDC | 64 VDC | 80 VDC | 90 VDC | ||
1 | 2 | 3.2 | 4.2 | 5.2 | |
2 | 2.1 | 3 | 4.1 | 5.1 | |
3 | 2 | 3.1 | 4.2 | 5.1 | |
4 | 2 | 3 | 4.2 | 5 | |
5 | 2 | 3 | 4.2 | 5.2 | |
6 | 2.1 | 3.1 | 4.1 | 5.2 | |
7 | 2 | 3 | 4.1 | 5.2 | |
8 | 2 | 3 | 4 | 5.1 | |
9 | 1.9 | 3.2 | 4.1 | 5 | |
10 | 2.1 | 3.1 | 4.2 | 5.2 | |
Mean | 2.02 | 3.07 | 4.14 | 5.13 | |
SD | 0.063 | 0.082 | 0.069 | 0.082 | |
Based on Table 10, for a frequency of 230 KHz the results of measuring the depth of the incision from the input voltage setting are 50-90 VDC. The highest uncertainty values are in the input voltage settings of 64 VDC and 80 VDC. From the standard deviation value, some of the measurement numbers are close to the average value of the measurement results.
Based on Table 11, for a frequency of 240 KHz the results of measuring the depth of the incision from the input voltage setting are 50-90 VDC. The highest uncertainty values are in the input voltage settings of 64 VDC and 80 VDC. From the standard deviation value, some of the measurement numbers are close to the average value of the measurement results. Based on Table 12, for a frequency of 250 KHz the results of measuring the depth of the incision from the input voltage setting are 50-90 VDC. The highest uncertainty values are in the input voltage settings of 64 VDC and 90 VDC.
Number | Cutting depth (mm) | ||||
50 VDC | 64 VDC | 80 VDC | 90 VDC | ||
1 | 1.8 | 3 | 3.8 | 5 | |
2 | 1.9 | 3.1 | 3.7 | 5.1 | |
3 | 1.8 | 3 | 3.7 | 5 | |
4 | 1.8 | 3 | 3.8 | 5 | |
5 | 1.8 | 3.2 | 3.6 | 5.2 | |
6 | 1.7 | 3.1 | 3.8 | 5 | |
7 | 1.8 | 3.1 | 3.8 | 5 | |
8 | 1.8 | 3 | 3.7 | 5.1 | |
9 | 1.9 | 3 | 3.6 | 5.1 | |
10 | 1.7 | 3.2 | 3.6 | 5 | |
Mean | 1.8 | 3.07 | 3.71 | 5.05 | |
SD | 0.066 | 0.082 | 0.087 | 0.070 | |
Number | Cutting depth (mm) | ||||
50 VDC | 64 VDC | 80 VDC | 90 VDC | ||
1 | 1.5 | 2.7 | 3.6 | 4.6 | |
2 | 1.5 | 2.6 | 3.5 | 4.5 | |
3 | 1.5 | 2.7 | 3.6 | 4.6 | |
4 | 1.4 | 2.5 | 3.6 | 4.6 | |
5 | 1.5 | 2.7 | 3.6 | 4.4 | |
6 | 1.5 | 2.6 | 3.7 | 4.6 | |
7 | 1.6 | 2.6 | 3.5 | 4.5 | |
8 | 1.5 | 2.7 | 3.6 | 4.6 | |
9 | 1.4 | 2.6 | 3.5 | 4.6 | |
10 | 1.5 | 2.6 | 3.6 | 4.5 | |
Mean | 1.49 | 2.63 | 3.58 | 4.55 | |
SD | 0.066 | 0.067 | 0.063 | 0.070 | |
From the results of sampling cutting data using chicken meat, the greater the voltage used on the tool, the deeper the incision that can be cut on the sample. The higher the frequency used, the lower the level of sparks and smoke generated. Then it can be known the level of safety for minor surgery using a pure cut mode bipolar electrosurgical unit with recommended frequencies above 210KHz can be applied to human body tissues. From the calculation of the standard deviation value, so it can be concluded that the measurement results 10 times for each voltage setting are close to the average measurement value.
From the results of data retrieval of power measurements using the ESU Analyzer, it can be concluded that the lowest measured power of 1.4W is at a voltage setting of 50 VDC with a frequency of 250KHz and the highest measured power of 10.4W is at a voltage setting of 90 VDC with a frequency of 210 KHz. The resistance used in the measurement is 100 Ohm.
The use of high frequency requires a very large power to be activated up to the output electrode. The ferrite transformer plays an important role in maintaining the frequency up to the electrodes. By setting the primary and secondary windings to obtain the desired voltage output. From this research, the variables that influence the effectiveness of the output electrode are the current, voltage and frequency used. The difference in frequency with a difference of 10KHz affects the power generated. This is because the consumption of current and voltage to activate the high frequency is very large. Therefore, from this study it is recommended to use a high frequency of 250KHz with a maximum input voltage of 90VDC to eliminate faradic effects and the level of spark effects.
After conducting this research, the authors conclude that from the results of frequency data retrieval at the oscillator output and inverter driver output, the set frequency can last up to the final step-up output without exceeding the percentage error value. For the use of higher frequencies, the voltage will decrease because high frequencies require a large enough power. From the test results on chicken meat samples, the difference in frequency usage between 210-250 KHz can be seen from the over spark effect that is generated. If the power at the final step-up output is measured using an ESU Analyzer with a certain resistance setting, the power generated at a frequency of 210KHz is greater than the frequency of 250KHz with the same input voltage.
[1] | R. A. Nabawi, D. A. Wibaksono, T. B. Indrato, and T. Rahmawati, “Electrosurgery Unit Monopolar (Cutting and Coagulation),” J. Electron. Electromed. Eng. Med. Informatics, vol. 1, no. 1, pp. 33–38, 2019, https://doi.org/10.35882/jeeemi.v1i1.7. |
[2] | P. S. Yalamanchili, P. Davanapelly, H. Surapaneni, “Electrosurgical applications in Dentistry,” Scholars Journal of Applied Medical Sciences (SJAMS), vol. 1, no. 5, pp. 530–534, 2013, https://saspublishers.com/media/articles/SJAMS15530-534_T2rpb8N.pdf. |
[3] | C. Bk, K. Kalaivani, T. Kalaiselvi, K. R. Sugashini, and B. Chinthamani, “Design of Improved Electrosurgical Unit with Pad Plate Design,” Int. J. Recent Technol. Eng., vol. 8, no. 4, pp. 10706–10711, 2019, https://doi.org/10.35940/ijrte.D4322.118419. |
[4] | K. Bree, S. Barnhill, and W. Rundell, “The Dangers of Electrosurgical Smoke to Operating Room Personnel: A Review,” Work. Heal. Saf., vol. 65, no. 11, pp. 517–526, 2017, https://doi.org/10.1177/2165079917691063. |
[5] | D. A. Friedrichs, R. W. Erickson, and J. Gilbert, “A new dual current-mode controller improves power regulation in electrosurgical generators,” IEEE Trans. Biomed. Circuits Syst., vol. 6, no. 1, pp. 39–44, 2012, https://doi.org/10.1109/TBCAS.2011.2159859. |
[6] | K. Rauff, A. Rilwan, U. Farouk, and D. Joshua, “Construction of a Simple Transformer to Illustrate Faraday’s Law of Electromagnetic Induction along Side Mutual Inductance,” Phys. Sci. Int. J., vol. 12, no. 1, pp. 1–5, 2016, https://doi.org/10.9734/PSIJ/2016/28280. |
[7] | C. Dias and S. V. Kamat, “Frenectomy: Management By Electrosurgery - A Report Of Two Cases”, Med. res. chronicles, vol. 7, no. 6, pp. 312-321, 2020, https://doi.org/10.26838/MEDRECH.2020.7.6.458. |
[8] | R. Ricks, S. Hopcroft, M. Powari, A. Carswell, and P. Robinson, “Tissue Penetration of Bipolar Electrosurgery at Different Power Settings,” Br. J. Med. Med. Res., vol. 22, no. 1, pp. 1–6, 2017, https://doi.org/10.9734/BJMMR/2017/33773. |
[9] | J. L. Tokar et al., “Electrosurgical generators,” Gastrointest. Endosc., vol. 78, no. 2, pp. 197–208, 2013, https://doi.org/10.1016/j.gie.2013.04.164. |
[10] | A. Ayesha, A. Nigam, and A. Kaur, “Principles of electrosurgery in Laparoscopy,” Pan Asian J Obs Gyn, vol. 2, no. 1, pp. 22–29, 2019, https://pajog.com/images/pajog/issue-image/All_issue. |
[11] | B. Crossley, “Dispelling confusion among various electrosurgery technologies,” Biomed. Instrum. Technol., vol. 52, no. 1, p. 76, 2018, https://doi.org/10.2345/0899-8205-52.1.76. |
[12] | A. K. Ward, C. M. Ladtkow, and G. J. Collins, “Material removal mechanisms in monopolar electrosurgery,” Annu. Int. Conf. IEEE Eng. Med. Biol. - Proc., pp. 1180–1183, 2007, https://doi.org/10.1109/IEMBS.2007.4352507. |
[13] | K. Gallagher, B. Dhinsa, and J. Miles, J., “Electrosurgery”, Surgery (Oxford), vol. 29, no. 2, pp.70-72, 2011, https://doi.org/10.1016/j.mpsur.2010.11.009. |
[14] | N. Sanajit, W. Meesrisuk, “A High-Frequency PWM Half-Bridge Inverter for Electrosurgical Cutting Applications,” ICEMS 2018 - 2018 21st Int. Conf. Electr. Mach. Syst., pp. 827–830, 2018, https://doi.org/10.23919/ICEMS.2018.8549089. |
[15] | N. N. Massarweh, N. Cosgriff, and D. P. Slakey, “Electrosurgery: History, principles, and current and future uses,” J. Am. Coll. Surg., vol. 202, no. 3, pp. 520–530, 2006, https://doi.org/10.1016/j.jamcollsurg.2005.11.017. |
[16] | B. Irianto, L. Wakidi, A. Endarta, M. Ishag Adam, and H. Aamir, “A Low Cost Electrosurgery Unit (ESU) Design with Monopolar and Bipolar Methods”, Indonesian Journal of Electronics, Electromedical Engineering, and Medical Informatics, vol. 4, no. 2, pp. 48-54, 2022, https://doi.org/10.35882/ijeeemi.v4i2.1. |
Meilia Safitri, Design and Testing of Electrosurgery Unit