Journal of Fuzzy Systems and Control, Vol. 3, No 3, 2025 |
PLC–SCADA Based Control of Booster Pumps with Alternating Operation and PID Regulation
Viet-Truong Nguyen 1, Anh-Son Hoang 2,*, Van-Dong-Hai Nguyen 3, Thi-Quynh-Huong Hoang 4, Ho-Anh-Vu Ho 5,
Tan-Tai Tran 6, Mai-Bao Trung 7, Le-Cong-Vinh Nguyen 8, Thi-Thuy-Duong Do 9, Binh-Hau Nguyen 10,
Le-Phuc-Khuong Nguyen 11, Duc-Hieu Nguyen 12, Duy-Thinh Le 13
1, 2, 3, 4, 5, 6, 7, 8, 9, 11, 12, 13 University of Technology and Education (HCMUTE), Ho Chi Minh City (HCMC), Vietnam
10 Posts and Telecommunications Institute of Technology, Ho Chi Minh City (HCMC), Vietnam
Email: 1 21151378@student.hcmute.edu.vn, 221151330@student.hcmute.edu.vn, 3 hainvd@hcmute.edu.vn,
4 21161057@student.hcmute.edu.vn, 5 21145324@student.hcmute.edu.vn, 6 21142168@student.hcmute.edu.vn,
7 20142425@student.hcmute.edu.vn, 8 20151323@student.hcmute.edu.vn, 9 21116296@student.hcmute.edu.vn,
10 haunb@ptit.edu.vn, 11 20161216@student.hcmute.edu.vn, 12 21151416@student.hcmute.edu.vn,
13 21142183@student.hcmute.edu.vn
*Corresponding Author
Abstract—In the current context, the demand for clean water in daily life and in industrial environments is increasing, showing that the need for improved operation of water supply systems as well as management efficiency is essential. The pressure pump system is one of the important factors that help improve the stability of the water supply demand. The system helps ensure the quality of the water supply, has the function of maintaining stable pressure in the pipeline, avoiding sudden pressure changes that damage equipment, causing unsafe incidents at the operating site, and for users. This paper presents an experimental study on a booster pump system model integrated with programmable logic controller (PLC) and supervisory control and data acquisition (SCADA) technologies, along with a human-machine interface (HMI), to automate operation, alternate pump operation, apply proportional integral derivative (PID) control without an expansion tank, and monitor the system without manual or semi-automatic intervention. Based on the experiment and evaluation methods, the study shows the potential for improving the pressure pump system in the wastewater treatment and domestic water supply industry.
Keywords—PLC Controller; SCADA; PID Control; HMI
In the context where the number of factories, enterprises, and households is increasing, the demand for clean water for daily life and industrial environments is also rising. This shows that the requirement to improve the operation of the water supply system, as well as the efficiency of management, is extremely essential [1]. The pressure pumping system is one of the important factors that help improve stability in meeting the demand for water supply [2]. The system ensures the quality of water supply, functions to maintain stable pressure in the pipelines, and prevents sudden pressure changes that can damage equipment, causing unsafe incidents at the operating site and for users. However, at present, manual or semi-automatic operation methods are still widely applied in water treatment plants. These two methods have revealed many major disadvantages, reduced the productivity of the plants, and decreased reliability and safety when the pumping system requires high and continuous supervision [3].
A recent study applied Machine Learning algorithms for pump systems to enable predictive maintenance for water injection pumps in the oil and gas industry. The study employed traditional machine learning methods such as regression, decision tree, support vector machine, random forest, to forecast failures, classify faults, and optimize maintenance using sensor data. The advantages of this approach include reducing downtime, increasing reliability, saving costs, and improving environmental safety [4]. Another study proposed an industrial-standard IoT-based design method for pumping stations. This research used a distributed SCADA model, with OPC/KEPServerEX as the OPC Server at the control center, and pumping stations equipped with Siemens S7-1200 PLCs connected to the Internet via 3G/4G, allowing monitoring and control from the Internet through remote access. The application of IoT and such models in pumping systems helps the system operate more stably [5]. In another study, a turbine-type flow sensor was designed and optimized using computational fluid dynamics (CFD) in combination with a booster pump system (BPS) to improve pump system performance. Data were collected from pump laboratory experiments, where a low-flow pump was maintained at a set pressure. Then the flow-and-frequency control algorithm was activated to increase the inverter frequency and thus the output power of the drive pump. The results showed that the flow measurement accuracy was within 4%, with a measurement uncertainty of about 0.4% [6]. There is a study on the application of PLC combined with KingView for monitoring and controlling my water. This study focuses on building an automatic monitoring system for the drainage process, in which PLC takes on the role of collecting sensor signals and controlling the pumping equipment, while KingView is used to display system status, alarms, and store data. The primary objective of the study is to enhance automation levels, minimize reliance on manual operations, and ensure safety in the mining environment [7].
Although IoT and machine learning approaches offer substantial opportunities for intelligent monitoring and predictive maintenance, they suffer from several significant drawbacks. IoT systems are heavily dependent on reliable communication infrastructure, which in industrial environments may be subject to latency or interruptions [8]. Moreover, implementing full IoT solutions often incurs high upfront costs, and ensuring cybersecurity adds further complexity [9]. Machine learning models typically require large, clean datasets for training data that, in pump systems, may be sparse, noisy, or inconsistent [10]. They often act as “black boxes,” making parameter tuning and result interpretation difficult [11]. When real-time control is required, processing delays and computational dependencies can undermine reliability, especially compared to traditional control techniques like PID.
In this context, very few studies have addressed the question of maintaining pipeline pressure stability without the use of pressure tanks, while integrating PLC-SCADA with PID control to operate booster pumps in a fully automated, dependable manner. This gap is important because eliminating pressure tanks reduces capital costs, saves installation space, and lowers the risk of mechanical failure, while still allowing for continuous operation. Therefore, a solution based on PLC-SCADA combined with PID control not only offers novelty academically but also significant practical value for water supply and industrial systems that demand high-pressure stability. Recent works have highlighted the proven reliability of PLC-based PID in various domains, such as real-time pH neutralization control using Palm Oil Mill Effluent [12], pump flow regulation experiments employing PLCs [13], and comparative studies of PID performance across different PLC series in hydraulic systems [14]. These studies confirm that PID remains a robust, transparent, and industry-proven solution for safety-critical applications, underscoring its suitability for automated booster pump systems.
Previous studies have mainly used PLC-SCADA, but they did not integrate automatic PID and alternate operation for the booster pump system. In this study, we focus on a booster pump system using PLC combined with SCADA, and the results provide significant advantages in monitoring and control due to real-time data acquisition, intuitive interfaces, and centralized management [15]. The integration of a PID controller helps maintain stable operating parameters, especially pipeline pressure, automatically and accurately [16], with two booster pumps operating alternately to adjust and sustain stable pipeline pressure while distributing the load evenly to extend motor lifespan and reduce maintenance costs [17].
In addition, the system is supported by HMI screens, allowing operators to interact directly with the equipment, monitor system status, receive alerts, and easily adjust parameters [18]. With the integration of PLC, SCADA, PID, and HMI, the system achieves high flexibility, stability, and reliability, ensuring efficient pump operation while minimizing manual intervention [19].
The objective of this research is to develop an integrated automation system for a dual-pump booster station that combines PLC, SCADA, and PID control technologies. The proposed configuration focuses on maintaining constant pipeline pressure without the need for a pressure tank, while ensuring alternating pump operation for load balancing and equipment longevity. Through the integration of real-time monitoring and centralized supervision via SCADA and HMI interfaces, the system is expected to enhance operational reliability and minimize manual intervention. The design approach follows advanced control strategies applied in hydraulic power systems [20] and incorporates recent progress in intelligent optimization of PID parameters for improved dynamic response [21]. The overall goal is to establish a cost-effective and scalable control framework suitable for both industrial and municipal water distribution systems.
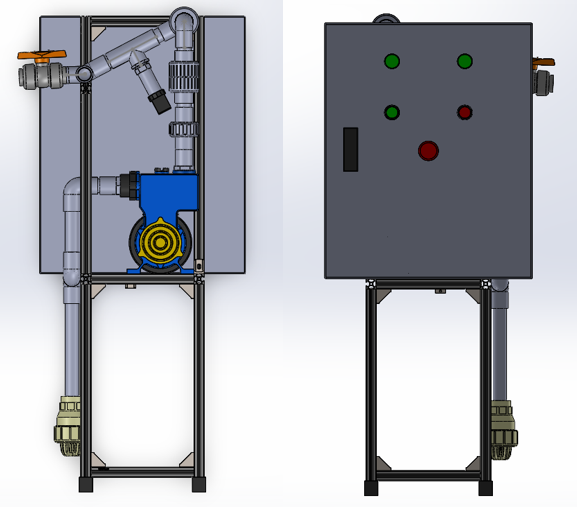
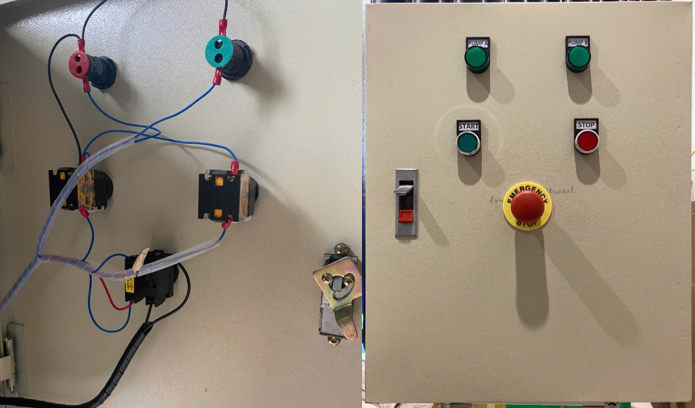
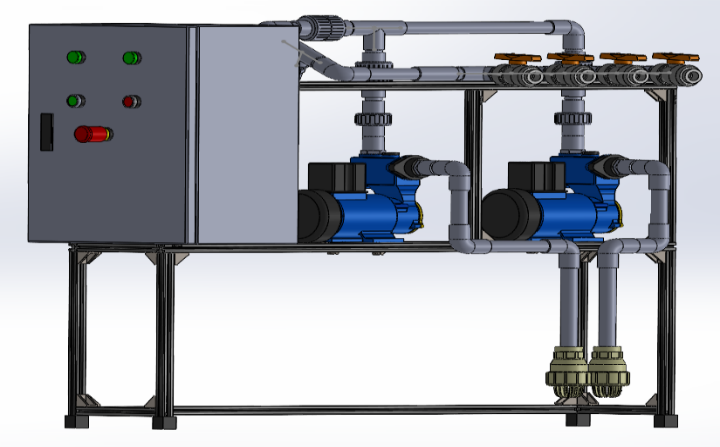
Central control cabinet: Located on the left side, at the front of the supporting frame. It includes 2 indicator lights showing the operating status of the two pumps and 3 control push buttons: Start (system start), Stop (system stop), E-Stop (emergency stop). Two green pumps, installed in parallel, are connected to the inlet and outlet piping system via PVC couplings. A pressure sensor is installed between the pipes to monitor pressure. The piping system consists of 27 mm PVC pipes assembled with L-shaped (90° elbow) and T-shaped fittings. Check valves are installed to prevent water from flowing back to the pumps. The height from the suction point to the discharge point is 0.75 m, with a total pipe length of 1.5 m. The model simulates varying water consumption by opening and closing 4 manual valves. The support frame is made of 20×20 mm aluminum, with total dimensions of 1000×200×900 mm, ensuring durability, light weight, and stability during equipment installation.
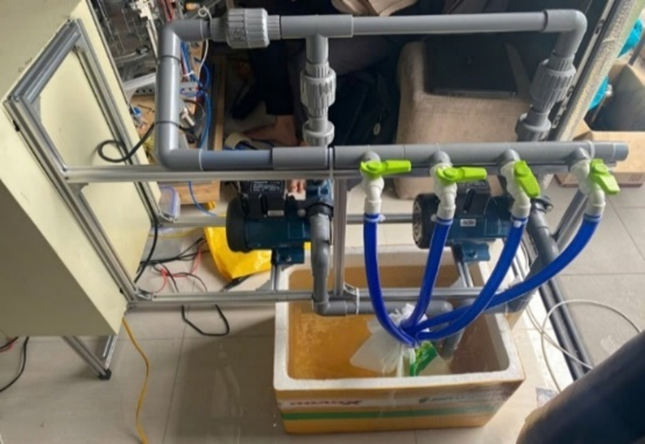
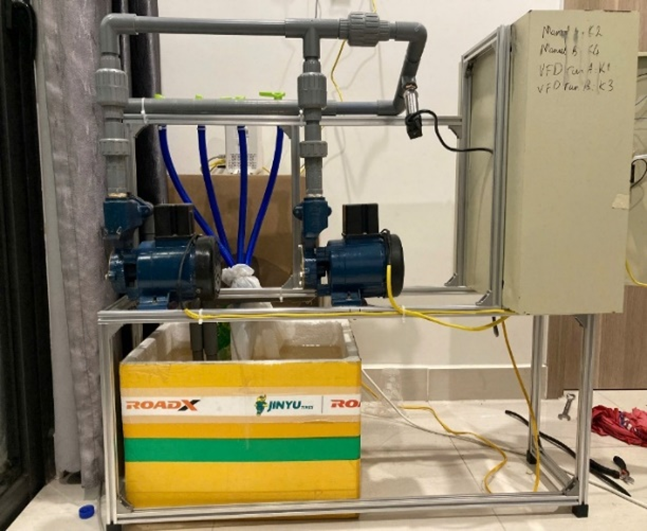
In Fig. 1, we present an overview model of the system designed using SolidWorks software. In Fig. 2, we present the right and left sides of the model. In Fig. 3, we have the completed model of the system. In Fig. 4, we have the rear view of the completed model.
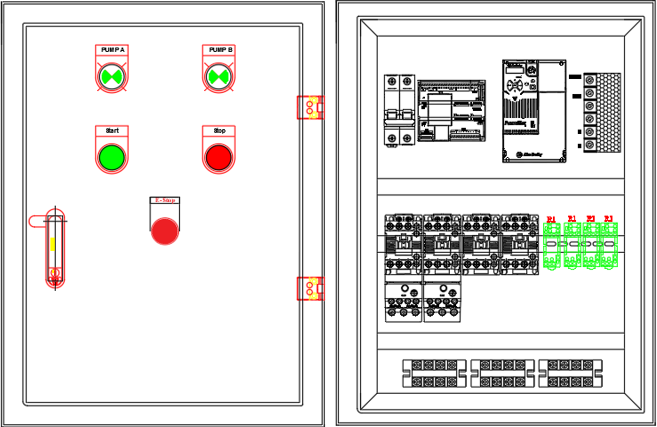
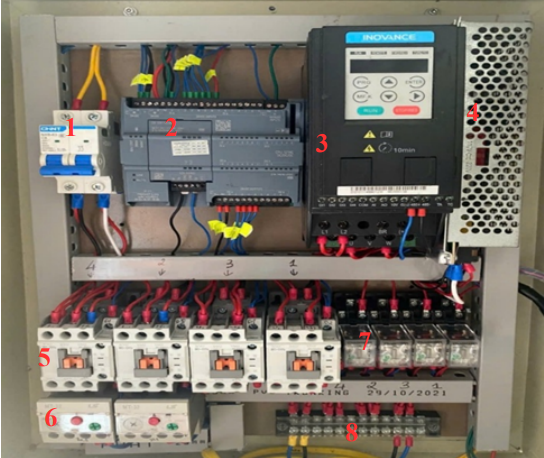
In Fig. 5, we have the front and internal views of the control cabinet design. In Fig. 6, the electrical cabinet interior is shown in detail. In Fig. 7, the exterior of the electrical cabinet is illustrated.
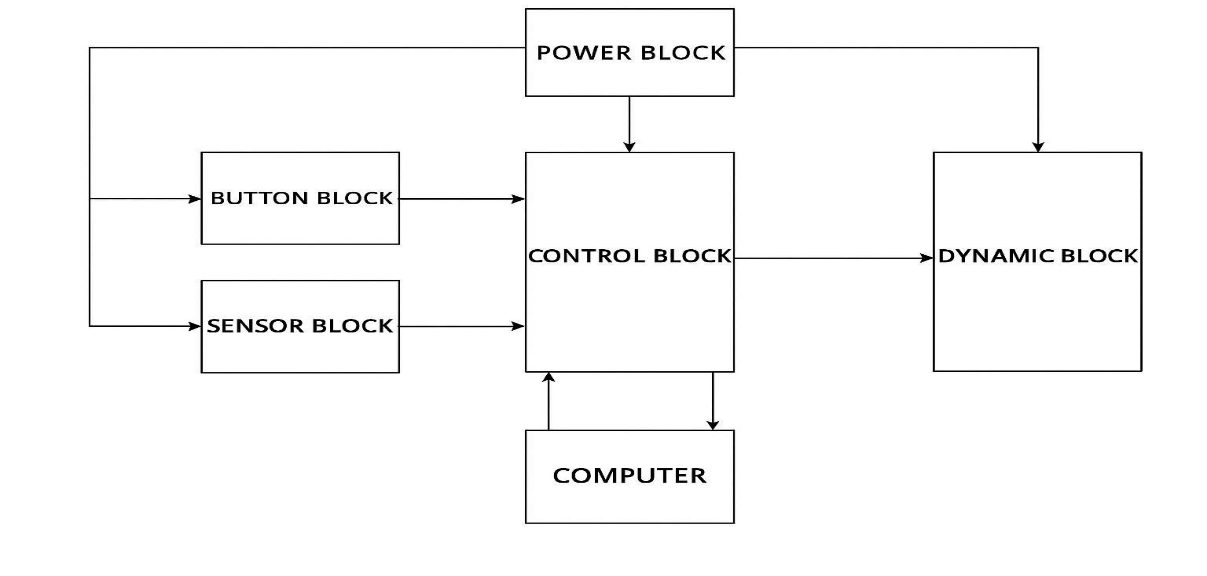
In Fig. 8, the structure of the system block diagram is displayed.
Structure includes:
Description of system block diagram:
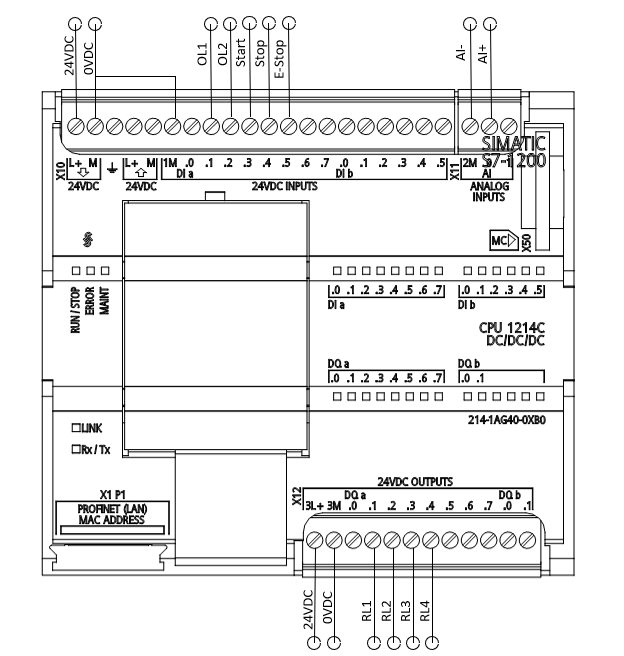
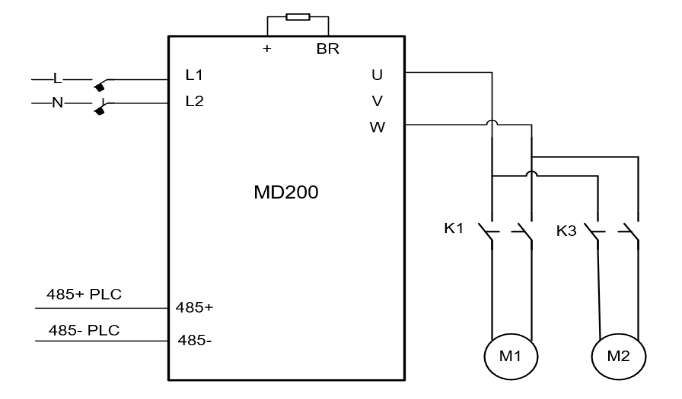
In Fig. 9, the PLC wiring diagram is illustrated in detail.
In Fig. 10, we have the inverter wiring layout, showing the detailed connection between components.
Inverter parameter settings:
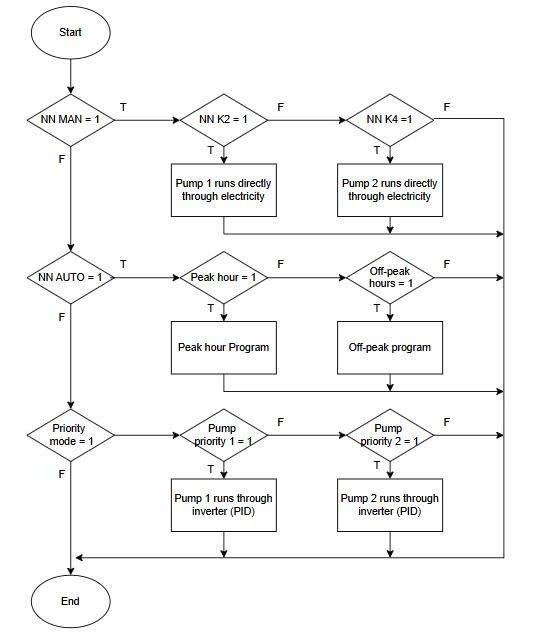
In Fig. 11, the general system flowchart is presented, describing how the control logic operates. NN MAN is the Pushbutton to select Manual mode. NN AUTO is the Pushbutton to select Auto mode. NN K2 is the Pushbutton to start Pump A (K2 is Contactor 1). NN K4 is the Pushbutton to start Pump B (K4 is Contactor 4).
Description: The system will operate in three main modes. First is the Manual mode, where the two pumps are switched on and off manually using pushbuttons and run directly from the power grid without speed adjustment. Next is the Automatic mode, in which the pumps operate automatically according to two predefined peak and off-peak time frames. In this mode, the pumps are controlled by the inverter through a PID controller to maintain the desired system pressure. The final mode is the Priority mode, where one pump is selected as the priority pump to run via the inverter, with adjustable speed control to meet the required pressure.
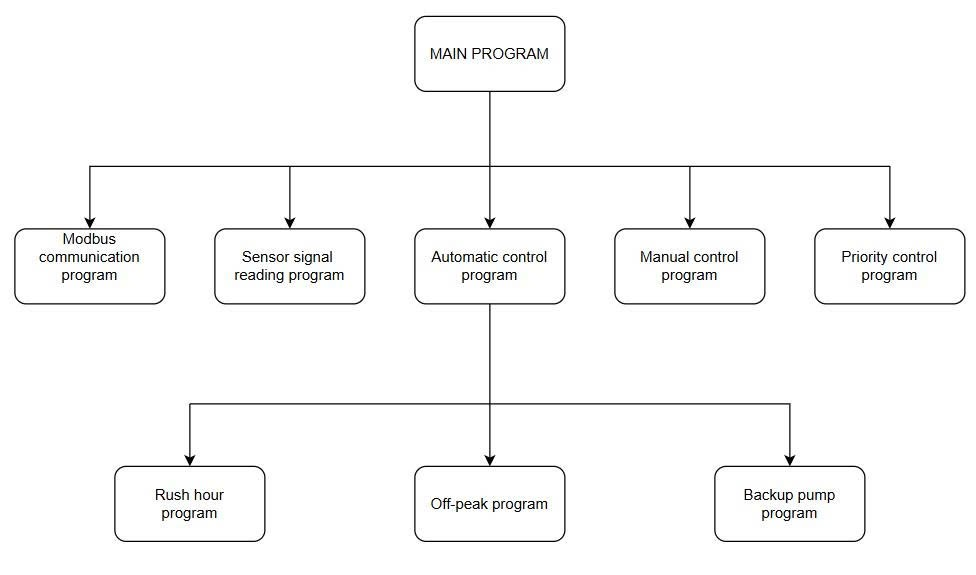
In Table 1, we have the list of PLC input and output signals used in the system. In Fig. 12, we have the control program block diagram, showing the main logic structure of the system.
Input/Output Name | Address | Notes |
OL1 | I0.0 | Thermal relay for Pump A protection |
OL2 | I0.1 | Thermal relay for Pump B protection |
START | I0.3 | System start pushbutton |
STOP | I0.4 | System stop pushbutton |
E-Stop | I0.5 | Emergency stop pushbutton |
SS | IW64 (AI 0) | Pressure sensor signal |
Output assignment table | ||
RL1 | Q0.1 | Relay controlling Contactor 1 |
RL2 | Q0.2 | Relay controlling Contactor 2 |
RL3 | Q0.3 | Relay controlling Contactor 3 |
RL4 | Q0.4 | Relay controlling Contactor 4 |
According to Fig. 11, the main program includes the following subprograms:
The HMI interface is designed with 6 monitoring and control screens: AUTO SCREEN, MANUAL SCREEN, SETTING SCREEN, MONITOR SCREEN, I/O SCREEN, and ALARM SCREEN.
The “MANUAL SCREEN” HMI interface displays the manual control mode for the system. The screen provides control buttons to switch Pump A and Pump B on or off on the left side of the screen. In addition, pump status can be monitored through indicator lights or the text “OK” shown in the middle and right side of the screen. NN AUTO: Pushbutton to select Auto mode.
The layout of this screen is quite intuitive, the control buttons are large in size, and the colors are clear, so it is easy to operate. When the pump has a problem or stops working, the indicator light and display status will change to help the operator immediately recognize. The feedback signals are updated in real time, so the pump status monitoring is very accurate, ensuring the system operates safely and stably. In Fig. 13, we have the MANUAL SCREEN interface, which displays the manual control mode of the system.
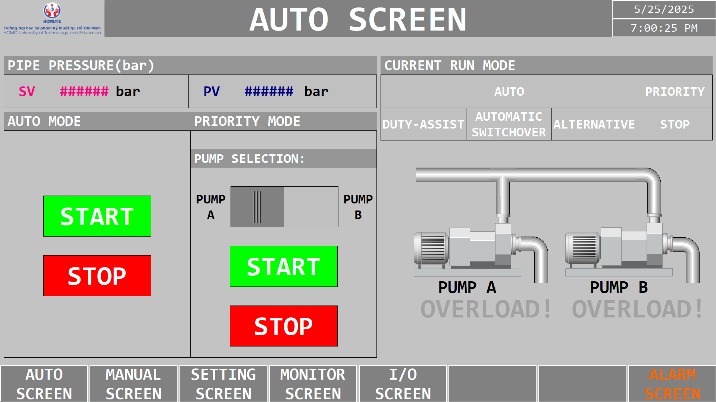
The HMI interface "AUTO SCREEN" displays the automatic control mode for the booster pump system. The screen provides information about pipeline pressure through two values: SV (Set Value) and PV (Present Value). In the interface, the operator can perform control on the left side of the screen with 2 modes: automatic mode (AUTO MODE), priority mode (PRIORITY MODE). The right side of the screen helps monitor the operating status of each mode as well as the status of the two pumps. In AUTO mode, the following states can be monitored: adding an additional pump when one pump is not enough to maintain pressure (DUTY-ASSIST), backup pump when one pump fails (AUTOMATIC SWITCHOVER), and alternating pump operation (ALTERNATIVE). In addition, there is an “OVERLOAD!” warning status to indicate that both pumps are overloaded. The navigation bar at the bottom of the screen allows quick access to other functional screens.
This screen is very reasonably arranged, and important information, such as pressure and pump status, is easy to read and continuously updated. When there is a problem or pressure exceeds the threshold, the warning is displayed immediately for timely handling. Thanks to the direct signal acquisition from the sensor and PLC, the data is always accurate and stable, ensuring high reliability when operating in automatic mode. In Fig. 14, we have the AUTO
SCREEN interface, which represents the automatic control mode of the system.
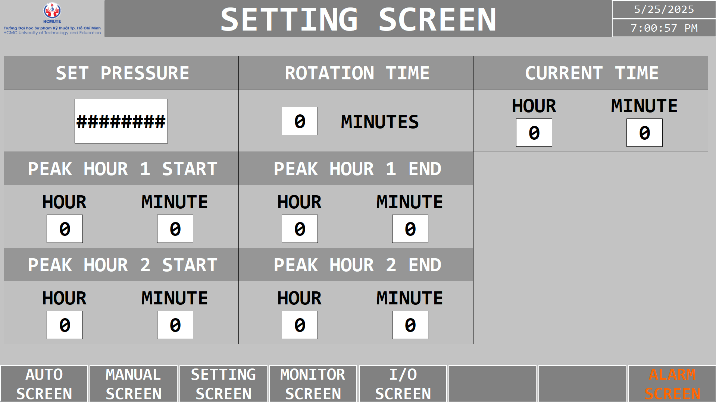
The HMI interface “SETTING SCREEN” provides a screen for setting the desired pressure value (SET PRESSURE), the alternating pump operation time (ROTATION TIME) for the off-peak mode, and two peak-hour time frames with customizable start time (PEAK HOUR START) and end time (PEAK HOUR END).
The system has a mechanism to check the input value limit, so setting errors are limited. If the operator enters the wrong value or exceeds the threshold, the screen will display a warning right at that position. Parameter changes are all responded back from the PLC to ensure that the actual setting value is saved and applied correctly, making the operation more stable and accurate. In Fig. 15, we have the SETTING SCREEN interface, which shows how users can configure system parameters and adjust operation values directly.
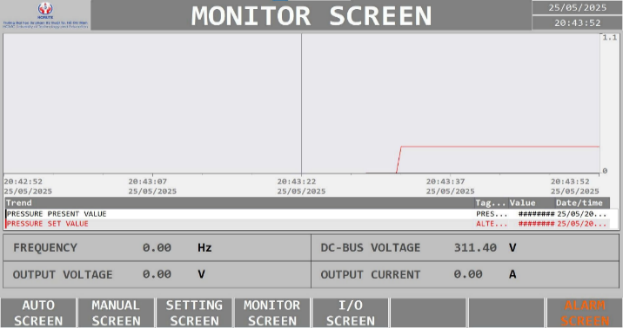
HMI interface, “MONITOR SCREEN,” displays a chart tracking response of actual pressure (pressure present value) compared with the set pressure (pressure set value) in real-time. Additionally, it displays parameters such as frequency, output voltage, output current, and DC-bus voltage.
The graph is displayed in contrasting colors, easy to observe, and automatically adjusts the scale so that the viewer can easily recognize pressure fluctuations. When the pressure or current exceeds the limit, the screen will display a flashing signal to warn. Thanks to the data continuously collected from the sensor, the operator can grasp the system status immediately and accurately, ensuring the stability of the entire operation. In Fig. 16, we have the MONITOR SCREEN interface showing the real-time monitoring of pressure and system parameters.
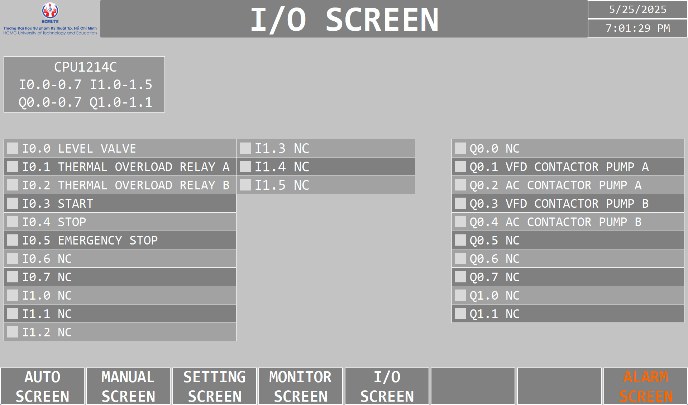
The HMI interface “I/O SCREEN” allows monitoring of the input and output states used in the model. If there is an input or output error or signal loss, the system will display a difference in color or border to warn. The data update is synchronized with the PLC scan cycle, so the displayed information is very accurate and stable, helping technicians detect and handle problems quickly. In Fig. 17, we have the I/O SCREEN interface displaying the system’s input and output monitoring layout.
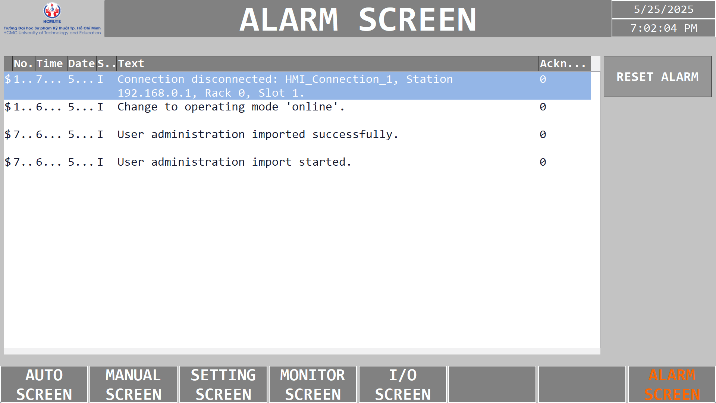
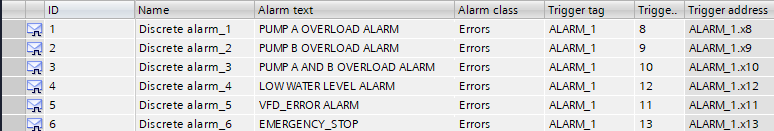
HMI interface “ALARM SCREEN" provides warnings about the overload status of Pump A, Pump B, or both, low water level warning, inverter fault, and emergency stop. Each alarm is represented by its own color and icon, allowing for quick recognition of its severity. After troubleshooting, the operator can acknowledge and clear the alarm to return the system to normal. All alarm data is recorded in memory for later reference, ensuring monitoring is always reliable and valid when needed for future inspection. In Fig. 18, the ALARM SCREEN interface displays system warnings such as pump overload, low water level, inverter faults, and emergency stop.
In Fig. 19, the operator can view and acknowledge various system alarms via the ALARM SCREEN, enabling prompt troubleshooting and system recovery.
With one valve open, the system reached the highest pressure among the four cases, while the time to reach the target pressure was relatively long. In Fig. 20, we illustrate the pressure profile obtained when opening a single valve (running one pump).
When two valves were opened, the pressure dropped significantly compared with the one-valve case, and the time to reach pressure was shortened. In Fig. 21, we illustrate the pressure profile obtained when opening two valves (running one pump).
In the three-valve case, the pressure continued to decrease, but the pressure was achieved faster than in the previous two cases. In Fig. 22, we illustrate the pressure response when three valves are opened (running one pump).
With four valves open, the pressure fell to the lowest level, while the time to reach pressure remained almost the same as in the three-valve case. In Fig. 23, we illustrate the pressure response when four valves are opened (running one pump).
This verification was carried out in pump call mode – DUTY ASSIST, where one pump operates via a frequency inverter and the other pump runs directly from the mains power.
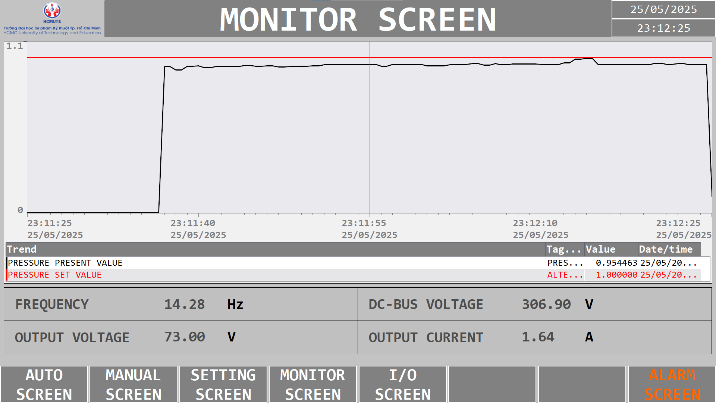
With one valve open, the system reached the highest pressure, but the time to reach the target pressure was the longest. The inverter-driven pump carried a higher current load than the mains-driven pump. In Fig. 24, we illustrate the pressure profile when opening one valve while running two pumps in DUTY ASSIST mode.
When two valves were opened, the pressure decreased compared with the single-valve case, while the response time was considerably shorter. The current of both pumps became more balanced. In Fig. 25, we illustrate the pressure profile when opening two valves while running two pumps in DUTY ASSIST mode.
In the three-valve case, pressure continued to fall, with response time remaining almost the same as in the two-valve case. Both pumps operated with nearly constant current values. In Fig. 26, we illustrate the pressure response when opening three valves while operating two pumps in pump call mode (DUTY ASSIST), with one inverter-driven and one mains-driven pump.
With four valves open, the system produced the lowest pressure, and the response time was similar to the previous case. The motor currents of the inverter-driven and mains-driven pumps were almost identical. In Fig. 27, we illustrate the pressure response when opening four valves while operating two pumps in pump call mode (DUTY ASSIST), with one inverter-driven and one mains-driven pump.
Table 2 summarizes the measured pressure, response time, and motor current for one-pump and two-pump operations across different valve configurations. Table 3 compares the overall performance between the two modes.
Case | Criterion | 1 Valve | 2 Valves | 3 Valves | 4 Valves |
Turn on a pump | Pressure achieved (bar) | 0.75 | 0.27 | 0.137 | 0.06 |
Time to reach pressure (s) | 2.5 | 1.5 | 1.0 | 1.0 | |
Motor current (A) | 0.98 | 0.86 | 0.84 | 0.84 | |
Turn on two pumps | Pressure achieved (bar) | 1.00 | 0.78 | 0.43 | 0.26 |
Time to reach pressure (s) | 36.5 | 12.0 | 11.0 | 11.5 | |
Motor current inverter (A) | 1.64 | 1.14 | 1.07 | 1.07 | |
Motor current grid (A) | 1.03 | 1.10 | 1.00 | 1.00 | |
Total motor current (A) | 2.67 | 2.24 | 2.07 | 2.07 | |
Difference | Pressure achieved (bar) | +0.25 | +0.51 | +0.293 | +0.20 |
Time to reach pressure (s) | +34.0 | +10.5 | +10.0 | +10.5 | |
Motor current (A) | +1.69 | +1.38 | +1.23 | +1.23 |
Criterion | One | Two Pumps (2P) | Remark |
Pressure Stability | Drops very quickly (0.75 → 0.06 bar) | Higher and more stable (1.00 → 0.26 bar) | 2P maintain pressure better, especially under heavy load |
Response | Very fast | Much slower (11 – 36.5s) | 1P is suitable when a quick response is required |
Energy Consumption (motor current) | Low | Higher (2.07 – 2.67A, about 2.1–2.7×) | 1P saves energy, 2 pumps consume more |
Reference Range | Meets only at light load (1 valve). < 0.3 bar when ≥2 valves | Can handle heavy load (2–4 valves) | For high load, 2P are necessary |
Considering the case where the system opens a maximum of 2 valves, the maximum pressure that can be achieved when both pumps operate is 0.78 bar. We set pressure values from 0.78 bar downward to test the response of the PID controller. In Fig. 28, the tuning parameters of the PID controller are illustrated, serving as the basis for subsequent control performance evaluations. PID controller parameters:  : 39.22366.
  : 1.991976.
  : 0.
: 0.
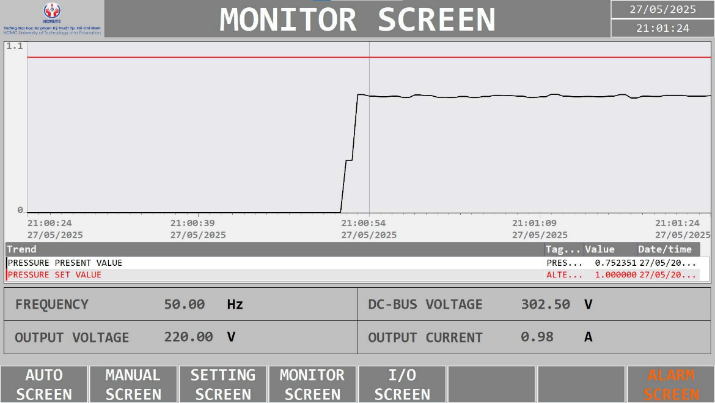
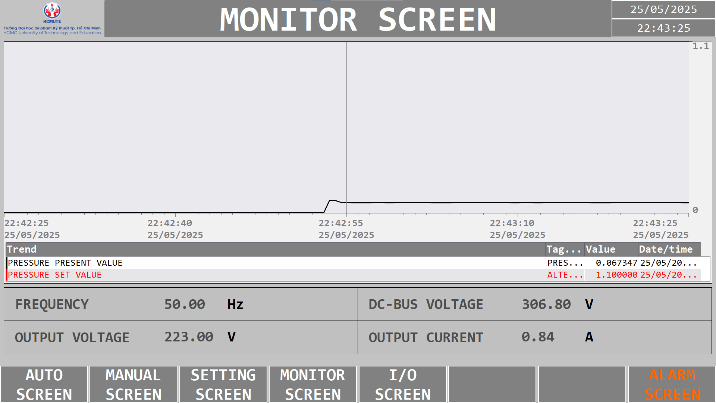
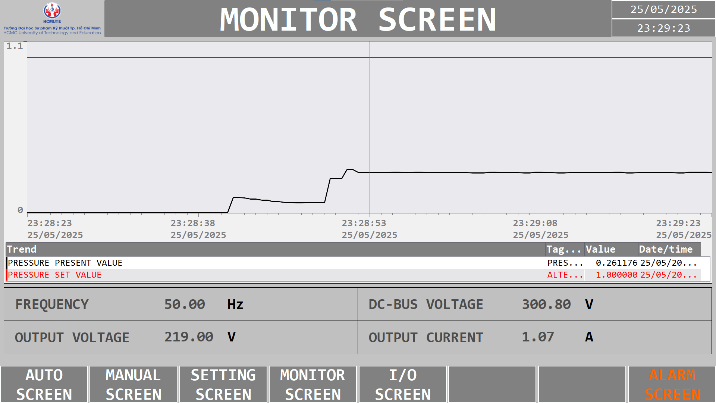
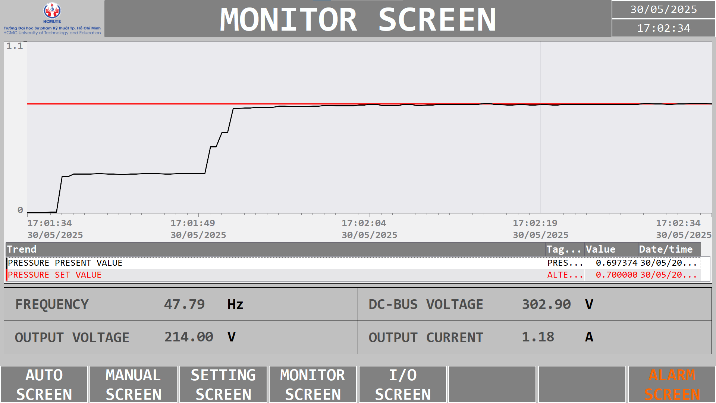
In Fig. 29, the response of the PID controller at a setpoint of 0.7 bar is shown. From Fig. 29, the data obtained are as follows:
Observation: For the system, a response time of around 30 s is acceptable. The output pressure rises steadily, following the setpoint. There is no oscillation around the setpoint after reaching steady state. The response curve is smooth, indicating system stability.
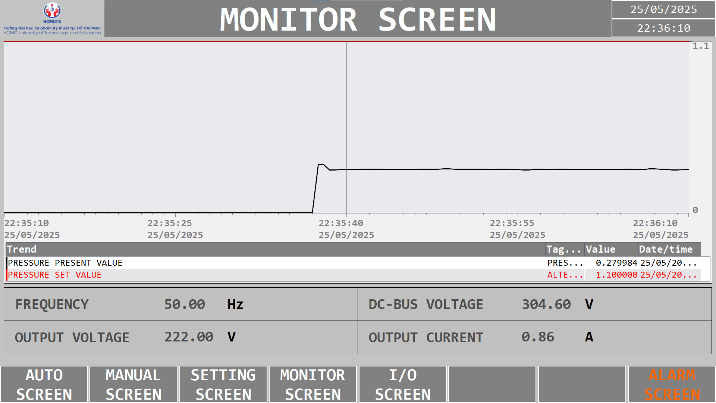
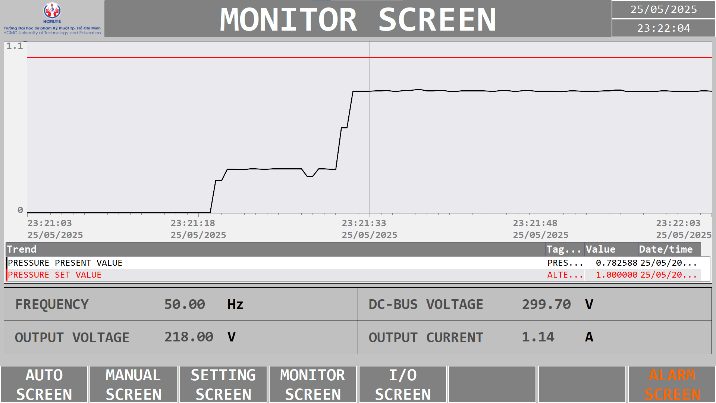
In Fig. 30, the system response to a setpoint of 0.6 bar is illustrated, indicating stable control with minimal overshoot. From Fig. 30, the data obtained are as follows:
Observation: The controller is still responding quite well, with a very small steady-state error and a slight increase in settling time. The overshoot is around 1%, and the system maintains stability without oscillation after the overshoot. The inverter operates at a lower frequency, and the output current is smaller, contributing to energy savings.
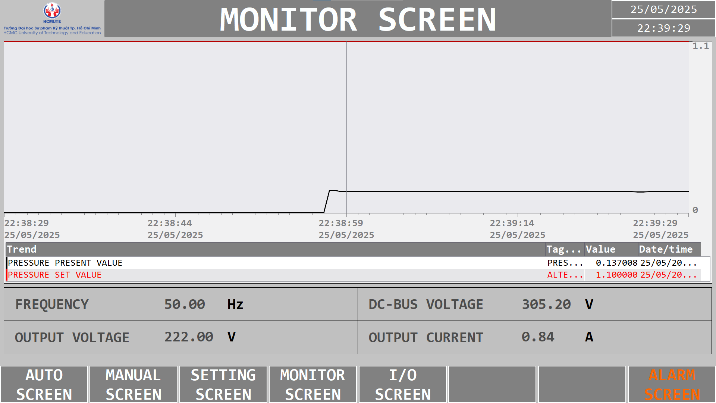
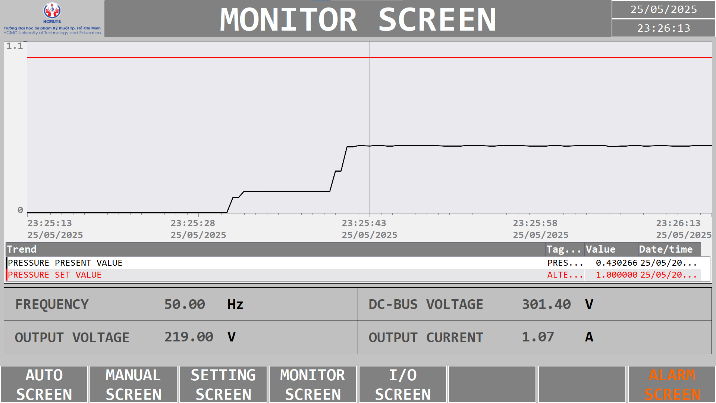
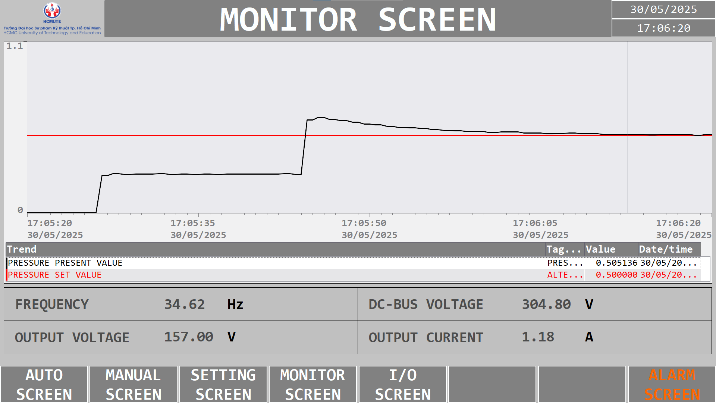
In Fig. 31, the system tracks the 0.5 bar setpoint with minor error and slightly longer settling time. From Fig. 31, the data obtained are as follows:
Observation: The controller still regulates the pressure to the setpoint, with a slightly increased steady-state error. The overshoot is around 3%, but it does not cause prolonged oscillation. The reduced frequency provides energy savings, but at the cost of decreased accuracy and increased overshoot.
All three cases show that the system is stable, with no repeated oscillations after reaching the setpoint. The overshoot increases slightly in each case, but there are no prolonged oscillations, indicating that the system has good self-correcting capability. The settling time has only minor differences and remains a suitable duration for control via the frequency inverter.
This study has achieved several notable contributions. The alternating booster pump system was successfully designed and implemented, enabling stable operation across different modes. A PID controller was integrated to maintain pressure without the need for an expansion tank, demonstrating clear effectiveness under experimental conditions. In addition, the SCADA system and HMI interface were developed to provide intuitive monitoring of operational parameters, while also incorporating safety mechanisms such as pump overload protection, inverter fault detection, and low water level alarms. The experimental results not only confirm the feasibility and reliability of the model but also reveal limitations that require further improvement, including a limited operating frequency range and a suboptimal pump alternation mechanism under varying flow conditions.
In the next stage, the research can be extended in several directions: integrating IoT and cloud computing to enhance remote monitoring and control, applying advanced controllers such as Fuzzy-PID or MPC, developing predictive maintenance functions, and paying particular attention to cybersecurity issues in SCADA. These directions are expected to further strengthen the applicability of the proposed solution in real-world water supply systems.
The video link of the operation of the system is: https://www.youtube.com/watch?v=4wgVZCoePgY.
Viet-Truong Nguyen, PLC–SCADA Based Control of Booster Pumps with Alternating Operation and PID Regulation