Journal of Fuzzy Systems and Control, Vol. 4, No 1, 2026 |
Study, Design, Modeling, Simulation, and Control Analysis of Single-Phase Rectifier AC-DC
Power Converters
Salam Waley Shneen 1,*
1 Energy and Renewable Energies Technology Center, University of Technology, Baghdad, Iraq
Email: 1* salam.w.shneen@uotechnology.edu.iq
*Corresponding Author
Abstract—Many researchers are interested in studying and analyzing electronic power systems due to their importance in providing the electrical quantities needed to meet load requirements. It's worth noting that there are different types of power sources, including direct current (DC) sources such as DC generators, batteries, or solar power, and alternating current (AC) sources such as diesel generators, wind power, and the main grid. Loads vary in that they require DC power, such as lighting, electric motors, and electronic devices. The most widely available power systems are single-phase AC systems, which can power loads of the same type. However, when DC loads, such as electric motors, are present, a rectifier is required to convert the DC current to AC. A rectifier consists of semiconductors such as diodes, thyristors, and transistors, and its output can be controlled by adjusting the operating period of the switches. This study aims to explore the differences between a single-phase half-wave rectifier and a full-wave rectifier. It presents a simulation model of a single-phase rectifier to conduct proposed tests to understand the system's behavior and analyze the simulation results to verify the rectifier's effectiveness in converting alternating current (AC) voltage to direct current (DC) voltage. The results confirm the convertibility capability, making the rectifier one of the important converters that can be used to supply DC loads with electrical power.
Keywords—Uncontrolled; Controlled; Half-Wave; Full-Wave; Single-Phase Rectifier
As a result of widespread development in various fields and systems, the use of semiconductors in the construction of conversion converters has also evolved. Electrical systems are among those systems that utilize converters as a component [1]-[3]. In various applications of electrical power systems, conversion is a crucial requirement, such as providing a constant voltage when a problem arises, like changing the speed of an electric motor, the rotation speed of a fan, or the intensity of lighting. Changes in frequency and the type of power supply, from alternating current (AC)
to direct current (DC) or vice versa, may also be
necessary [4]-[6].
A rectifier is a type of converter that provides a constant voltage from an alternating current (AC) source using semiconductors. A single-phase AC source can be used in conjunction with a half-wave or full-wave rectifier to power a DC load, providing the necessary power to meet the load's requirements [7]-[9]. Rectifiers are electronic circuits where conversion can be achieved using diodes, transistors, or thyristors. This requires a closed path for current to flow from the source to the load. Therefore, analyzing the current flow behavior necessitates understanding the function of each electronic circuit component. A diode allows current to pass through it when it is forward-biased (positive half-cycle of the input waveform) and blocks current when it is reverse-biased (negative half-cycle of the input waveform) [10]-[12].
As a result of the current flowing and not flowing, a voltage is present across the load terminals in a half-wave rectifier. This voltage occurs within a time period proportional to the positive half-wave of the input. The other type of rectifier differs in that it delivers voltage to the load via multiple electronic switches, allowing current to flow during both the positive and negative halves of the operating cycle. This is the main difference, which can lead to other variations, starting with the number of switches: one in a half-wave, while two or four electronic switches are used in a full-wave. The analysis involves determining the efficiency of both half-wave and full-wave rectifiers. Studies have shown that full-wave rectifiers are more efficient than half-wave rectifiers. To verify these and other differences, the methodology for both half-wave and full-wave rectifiers can be reviewed, and tests can be conducted to enhance the application with a resistive load. The reason full-wave rectifiers are more efficient than half-wave rectifiers is that the former uses only half the wave to convert DC power, while the latter uses the entire cycle—both positive and negative—to convert it to DC [13]-[15]. The design of a half-wave rectifier differs from that of a full-wave rectifier, which uses a single electronic switch connected in series with the source and load to complete a closed loop, making it suitable for low-voltage applications. The design of a full-wave rectifier addresses the core saturation problem that can occur with half-wave rectifiers. Therefore, the aim and contribution of this study is to design a full-wave rectifier so that current flows through the secondary winding in opposite directions, balancing the magnetic fluxes resulting from mutual induction. The simulation results indicate that full-wave rectifiers offer higher power and efficiency, and produce a lower ripple voltage than single-phase half-wave rectifiers. These results demonstrate the suitability of full-wave rectifiers for high-power applications, while half-wave rectifiers are more appropriate for lower-power applications. Full-wave rectifiers are the preferred choice for supplying DC loads from AC sources due to their superior performance and reliability compared to half-wave rectifiers [14]-[16].
The general components of a power electronics system can be represented in a block diagram as in Fig. 1. The simplest system that has a relationship and connection with electronic power devices can be expressed as in Fig. 2. The first part represents the input end of the system and is electrical energy whose function is to feed the system from one of the energy sources [17], [18]. Renewable energy is considered one of the most important of these sources because it is clean, i.e. environmentally friendly, such as solar energy, which comes from the sun, as well as wind energy, which comes from the wind. Batteries can also be a storage unit and feed the system with electrical energy in addition to the main electrical grid. The first part, the power source, is connected to the second part of the system, which is the electronic power devices, including electronic converters, where the input of the electronic power converter is connected to the power source, and the output of the electronic power converter is connected to the load, which is the third part, such as the electric motor or lighting units and other loads that operate on electrical energy [19], [20]. Electronic power converters include the converter input being a constant electrical quantity, such as current, voltage, frequency or angle, while we obtain those electrical quantities in variable values at the converter output [21], [22]. For example, the input of a current converter is constant in value, and its output is variable in value, as well as the rest of the electrical quantities, as in Fig. 3. The shapes of the components of electronic power converters can be identified through some pictures. There are elements that are used in practical time, including coils, capacitors, semiconductors, resistors, and sensors, in addition to the integrated circuit [23], [24], which represents real control units, as in Fig. 4.
Power electronic systems, such as power electronic transformers, are among the most important components of electrical power systems, as they are connected to the power supply, the grid, loads, and energy storage units [25], [26]. Important applications include regulating and operating electrical machines, communication systems, production lines in industrial applications, computer operation, and more [27], [28]. Transformers are of interest due to their ability to make systems operate with high efficiency and energy quality, thanks to the development of their sources, the treatment of distortions and harmonics, and the improvement of the power factor, a factor that has economic benefits [29], [30].
Description of the system through the operation of electronic switches and how to manage them to convert from the available quantities on the input side of the transformer and obtain the required quantities on the output side of those transformers of various types. The opening and closing periods of electronic switches can be controlled in variable proportions to obtain appropriate output power [31], [32]. Single-phase rectifiers are classified into two main categories: half-wave and full-wave, depending on the number of semiconductors. Each category has two types depending on the semiconductors used: a diode called an uncontrolled, and another type using a thyristor called a control [33]-[35].
(a)
(b)
(c)
| (1) |
| (2) |
| (3) |
| (4) |
| (5) |
| (6) |
| (7) |
| (8) |
| (9) |
| (10) |
| (11) |
| (12) |
Models representing single-phase rectifiers are used to understand system behavior by employing proposed tests to achieve the study objectives through the following contributions:
The first contribution involves constructing and designing a simulation model of a single-phase half-wave rectifier feeding a load of resistors, a resistor and an inductor, and a resistor and a capacitor. The second contribution involves constructing and designing a simulation model of a single-phase full-wave rectifier feeding a load of resistors, a resistor and an inductor, and a resistor and a capacitor, using diodes in one instance and thyristors in another.
The model is described as a single-phase rectifier with a resistive load, as shown in Fig. 7. Fig. 7 represents a single-phase rectifier control system using a single diode connecting the anode to the source and the cathode to the load. The diode allows current to flow in the positive half of the supply waveform and blocks it in the negative half. To verify this, the input and output waveforms can be plotted, and the electrical quantities analyzed according to the theoretical framework for this type of rectifier. The behavior of the system for the same model can be identified when the load is once a resistor, once a resistor and a capacitor, and a third time a resistor and a coil. Similarly, the model can be constructed by replacing the diode with a thyristor and reconstructing the three models with different load types, as in the previous case. The system behavior of the same model can be determined when the load is a resistor, then a resistor and a capacitor, and then a resistor and an inductor, as shown in Fig. 7 and Fig. 8.
This type consists of four electronic bridge switches, which can be four diodes or four thyristors, connected on one end to an AC power supply and on the other end to a DC load. The input and output waveforms can be plotted, and the electrical quantities analyzed according to the theoretical framework for this type of rectifier. The system behavior of the same model can be determined when the load consists of a resistor, then a resistor and a capacitor, and finally a resistor and an inductor.
The behavior of the system for the same model can be identified when the load is once a resistor, once a resistor and a capacitor, and a third time a resistor and a coil. Similarly, the model can be constructed by replacing the diode with a thyristor and reconstructing the three models with different load types, as in the previous case. The system behavior of the same model can be determined when the load is a resistor, then a resistor and a capacitor, and then a resistor and an inductor, as shown in Fig. 9 and Fig. 10.
This section utilizes the simulation models from the previous section to understand the behavior of a rectifier system connected to an alternating current (AC) source and converting it to direct current (DC) to meet load requirements. The simulation results include a single-phase with two variations: half-wave by using a single-phase switch and full-wave by using four single-phase. The simulations also cover in-control (using a diode) and control (using a thyristor).
The source voltage and frequency are determined for testing, and simulation results can be obtained to identify the system's behavior through current and voltage sensors and waveform mapping using an oscilloscope.
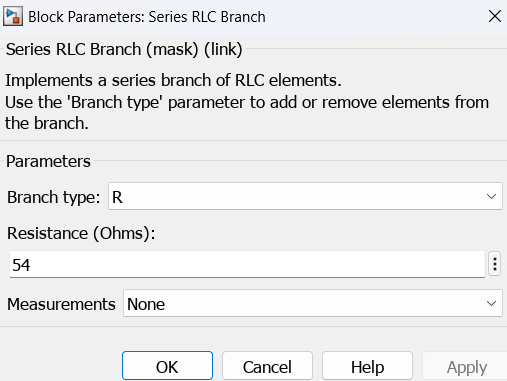
The simulation is in steps. A parameter block of the power supply can be represented as in Fig.11, which shows a voltage of 220 and a frequency of 50 Hz for test cases. There are other test cases that require 314 and a frequency of 50 Hz. A load parameter block can also be represented as in Fig. 12, which shows the resistance of 54 ohms for test cases, and there are other test cases where the resistance is 30 ohms.
(a)
(b)
(a)
(b)
The Fig. 13 represents the source voltage waveform for the two test cases when using a voltage of 50 Hz and voltages of 220 V and 314 V, as in Fig. 13.
(a)
(b)
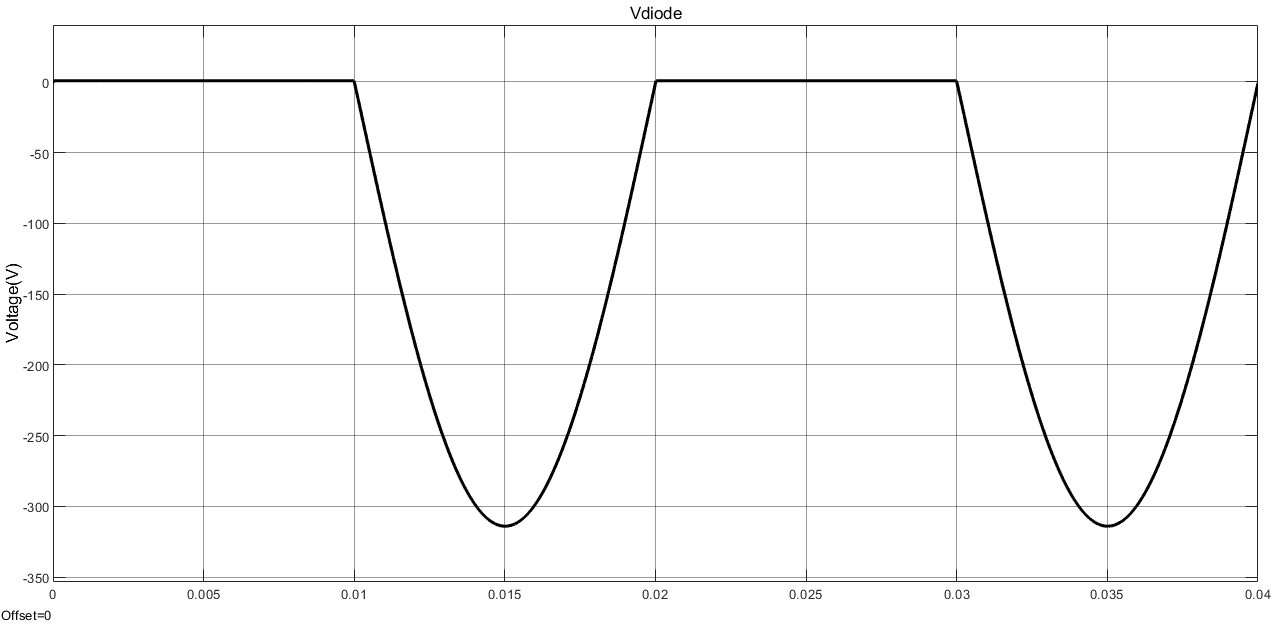
By using Fig. 7, the simulation of an uncontrolled half-wave single-phase rectifier with an R load system. The system's response can be obtained using the simulation model in Fig. 7, which can be illustrated in the Fig. 14 and Fig. 15:
Analysis and discussion of the simulation results for the first test case. Fig. 14 shows the diode voltage waveform, and Fig. 15 shows the output voltage waveform. From these, the amount of voltage on the load can be observed during the passage of current when the diode is forward-biased. This is within the positive half of the input waveform, and the other half is reverse-biased, and current is not allowed to pass, as shown in Fig. 14 and Fig. 15.
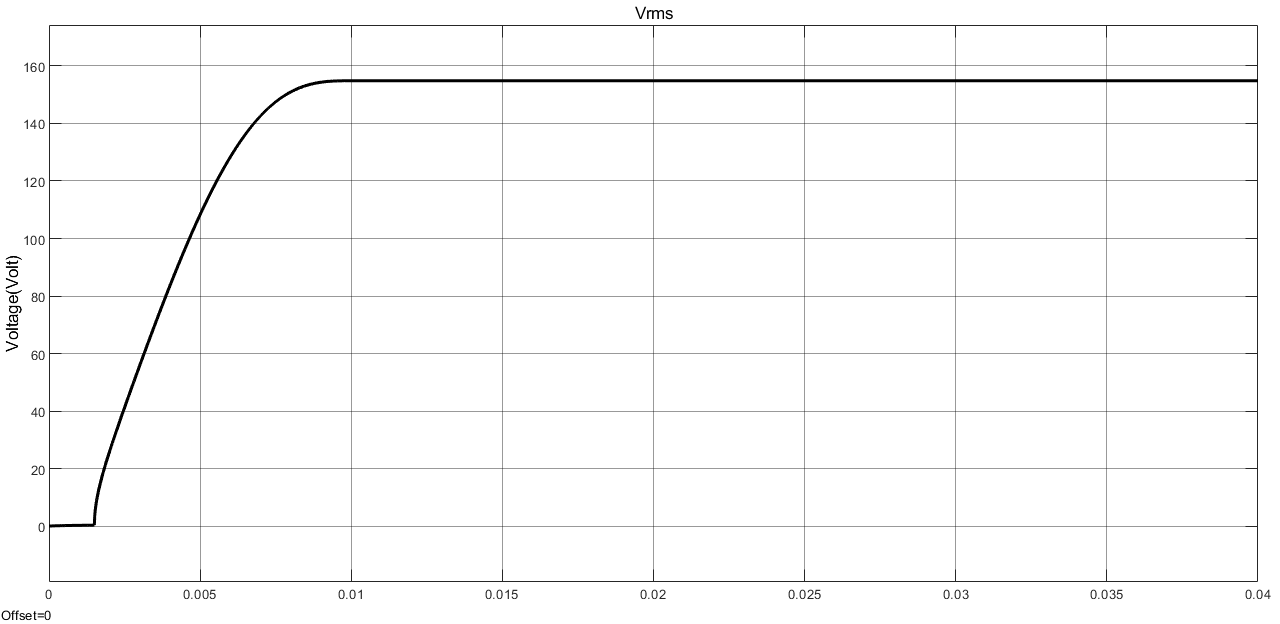
In Fig. 16, the simulation response of single phase rectifier for the root mean square of the output voltage. Also, Fig. 17 shows the simulation response of single phase rectifier for root mean square of the output current. By using Fig. 7, the simulation of an uncontrolled half-wave single-phase rectifier with R&C series load system, the system's response can be obtained using the simulation model in Fig. 7, which can be illustrated in the following Fig. 18 and Fig. 19. By using
Fig. 7, the simulation of uncontrolled half wave single phase rectifier with R&L series load system that the system's response can be obtained using the simulation model in Fig. 7, which can be illustrated in the following Fig. 20. By using
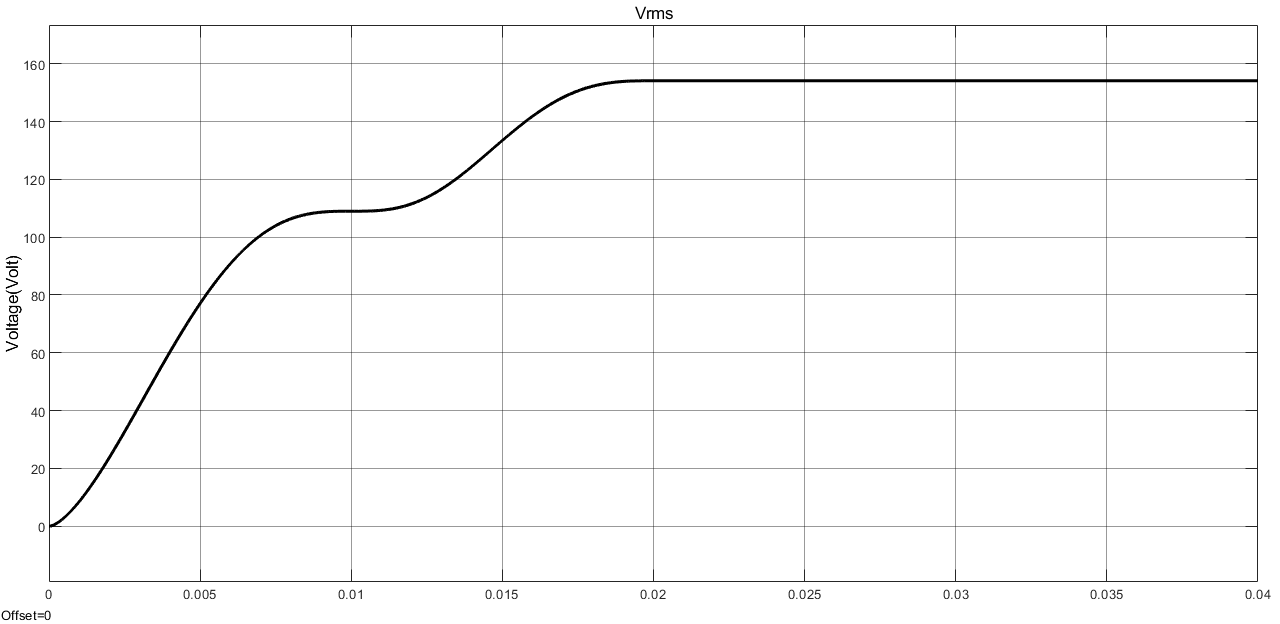
Fig. 8, the simulation of a controlled half-wave single-phase rectifier with R load system, the system's response can be obtained using the simulation model in Fig. 8, which can be illustrated in the following Fig. 21 to Fig. 24.
By using Fig. 8, the simulation of a controlled half-wave single-phase rectifier with R&L series load system, the system's response can be obtained using the simulation model in Fig. 8, which can be illustrated in the Fig. 25 and Fig. 27:
By using Fig. 8, the simulation of a controlled half-wave single-phase rectifier with R&C series load system, the system's response can be obtained using the simulation model in Fig. 8, which can be illustrated in the Fig. 28 to Fig. 32:
Table 1 show simulation response of an uncontrolled half-wave single-phase rectifier, including the electrical quantities of the system after performing the proposed simulation test for the half-wave single-phase rectifier. First, the output voltage and current, the output current value by mean and rms, that are measured in amperes, and the output voltage value by mean and rms. Second, the load types are resistive load, inductive load, and capacitive load (R, RL, RC).
.
Load Types | Output Voltage & Current Response | |||
Vout_mean | Vout_RMS | Iout_mean | Iout_RMS | |
R | 99.54 V | 156.5 V | 3.318 A | 5.216 A |
RL RC | 60.89 V 232.6 V | 185.2 V 235.4 V | 2.436 A 0.7161 A | 3.375 A 1.48 A |
Table 2 shows the simulation response of a controlled half-wave single-phase rectifier that includes the electrical quantities of the system after performing the proposed simulation test for the half-wave single-phase rectifier. First, the output voltage and current, the output current value by mean and rms, that are measured in amperes, also the output voltage value by mean and rms. Second, the load types are resistive load, inductive load, and capacitive load (R, RL, RC).
Load Types | Output Voltage & Current Response | |||
Vout_mean | Vout_RMS | Iout_mean | Iout_RMS | |
R | 94.25 V | 154.8 V | 1.745 A | 2.867 A |
RL RC | 168.7 V 71.08 V | 170.9 V 185.2 V | 0.5498 A 2.436 A | 1.127 A 3.375 A |
By using Fig. 9, the simulation of an uncontrolled full-wave single-phase rectifier with an R load system, the system's response can be obtained using the simulation model in Fig. 9.
Fig. 33 shows the simulation response for the waveform of the input voltage. Fig. 34 shows the simulation response for the waveform of Diode 1. Fig. 35 shows the simulation response for the waveform of Diode3. Fig. 36 shows the simulation response for the waveform of the output voltage with R load. Fig. 37 shows the simulation response for the waveform of Iavg with R load. Fig. 38 shows the simulation response for the waveform of Irms with R load. The simulation response for the waveform of Vrms with R load is shown in Fig. 39.
By using Fig. 9, the simulation of an uncontrolled full-wave single-phase rectifier with R&C series load system, the system's response can be obtained using the simulation model in Fig. 9. Fig. 40 shows the simulation response for the waveform of Irms with R&C load. Fig. 41 shows the simulation response for the waveform of Vrms with R&C load.
By using Fig. 9, the simulation of an uncontrolled full-wave single-phase rectifier with R&L series load system, the system's response can be obtained using the simulation model in Fig. 9. Fig. 42 shows the simulation response for the waveform of the output voltage. Fig. 43 shows the simulation response for the waveform of Iavg with R&L load. Fig. 44 shows the simulation response for the waveform of Irms with R load. The simulation response for the waveform of Vrms with R&L load as shown in Fig. 45.
By using Fig. 10, the simulation of controlled full wave single phase rectifier with R load system that the system's response can be obtained using the simulation model in
Fig. 10, which can be illustrated in the Fig. 46 to Fig. 54:
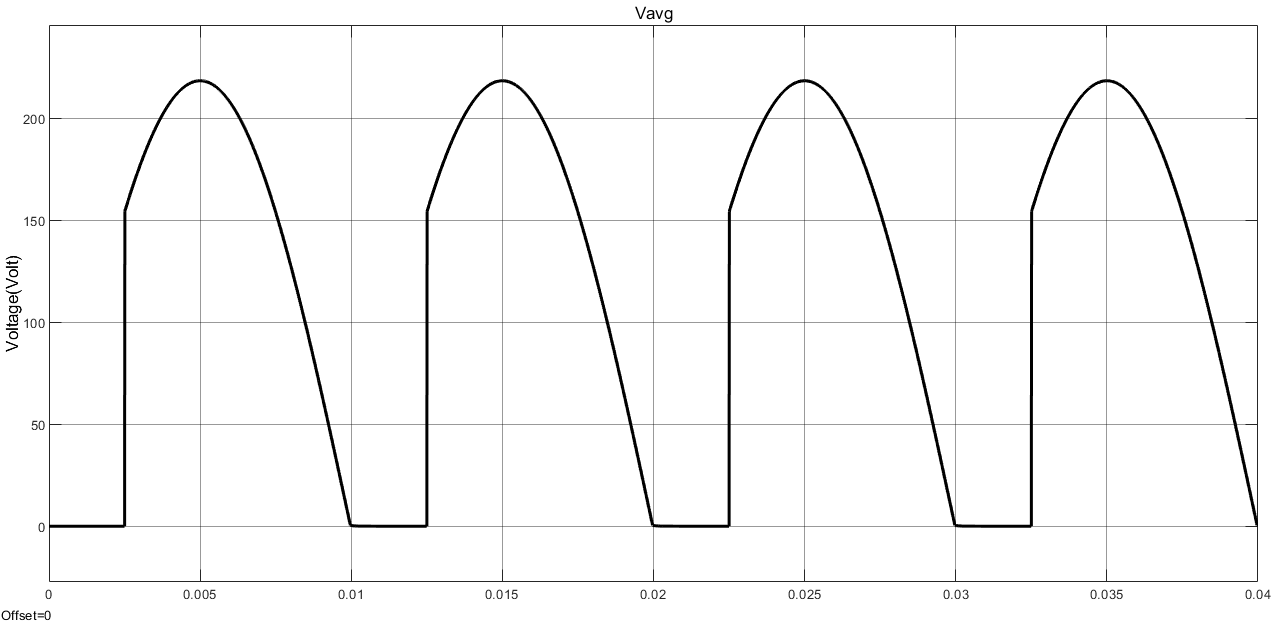
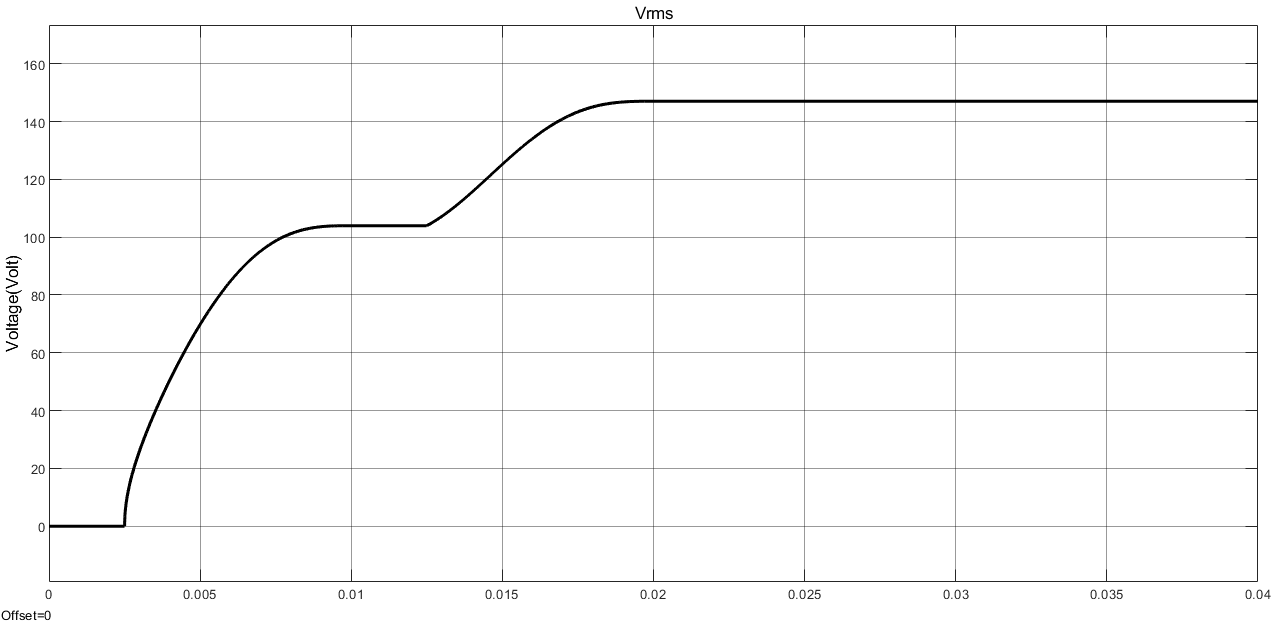
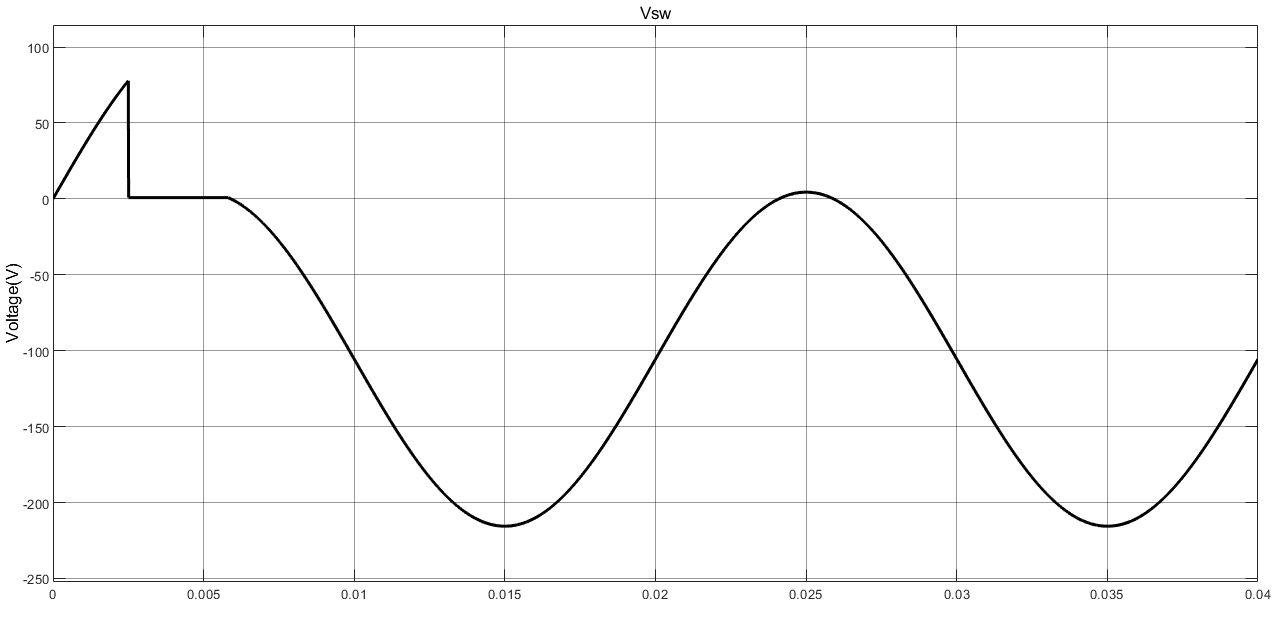
Fig. 46 shows the simulation response for the waveform of the pulse generator. Fig. 47 shows the simulation response for the waveform of the input voltage. Fig. 48 shows the simulation response for the waveform of Vsw1 with R load. The simulation response for the waveform of Vsw3 with R load, as shown in Fig. 49. The simulation response for the waveform of the output voltage. Fig. 51 show simulation response for the waveform of Iavg with R load. The simulation response for the waveform of Irms with R load as shown in Fig. 52. The simulation response for the waveform of Vavg with R load as shown in Fig. 53. The simulation response for the waveform of Vrms with R load as shown in Fig. 54.
By using Fig. 10, the simulation of a controlled full-wave single-phase rectifier with R&C series load system, the system's response can be obtained using the simulation model in Fig. 10, which can be illustrated in the Fig. 55 to Fig. 60:
By using Fig. 10, the simulation of a controlled full-wave single-phase rectifier with R&L series load system, the system's response can be obtained using the simulation model in Fig. 10, which can be illustrated in the Fig. 61 to Fig. 67:
Table 3 resume the simulation response of an uncontrolled full-wave single-phase rectifier that includes the electrical quantities of the system after performing the proposed simulation test for the half-wave single-phase rectifier. First the output voltage and current, the output current value by mean and rms that measured in ampere, also the output voltage value by mean and rms. Second the load types by use resistive load, inductive load and capacitive load (R, RL, RC).
Load Types | Output Voltage & Current Response | |||
Vout_mean | Vout_RMS | Iout_mean | Iout_RMS | |
R | 138.5 V | 154.1 V | 5.538 A | 6.164 A |
RL RC | 198.3 V 187.3 V | 220.6 V 188.2 V | 6.315 A 0.382 A | 6.831 A 0.6726 A |
Table 4 resume the simulation response of a controlled full-wave single-phase rectifier that includes the electrical quantities of the system after performing the proposed simulation test for the half-wave single-phase rectifier. First the output voltage and current, the output current value by mean and rms that measured in ampere, also the output voltage value by mean and rms. Second the load types by use resistive load, inductive load and capacitive load (R, RL, RC).
Load Types | Output Voltage & Current Response | |||
Vout_mean | Vout_RMS | Iout_mean | Iout_RMS | |
R | 118.3 V | 147 V | 4.734 A | 5.881 A |
RL RC | 98.78 V 187.3 V | 156.1 V 188.2 V | 1.829 A 0.382 A | 1.831 A 0.6726 A |
This study presented simulation models for single-phase rectifiers, both half-wave and full-wave. Through testing, the effectiveness of these systems was verified, and their suitability for low-power applications was confirmed using half-wave rectifiers, while full-wave rectifiers are used for higher-power systems. The system behavior was identified for all proposed cases, and the output voltage and current of the rectifier were fixed in tables and waveforms of the input and output voltage and current, in addition to the electronic switching waveforms of diodes and thyristors.
This study simulates a single-phase rectifier that converts alternating current (AC) to direct current (DC) using MATLAB software. A system consisting of a single-phase rectifier, an AC power source, and a load is implemented. The AC source voltage is converted to DC to meet the load requirements using a half-wave or full-wave rectifier with diodes or thyristors. In this study, the system's behavior is investigated and analyzed through electrical feedback, specifically regarding changes in voltage and current.
Salam Waley Shneen, Study, Design, Modeling, Simulation, and Control Analysis of Single-Phase Rectifier AC-DC Power Converters