Journal of Fuzzy Systems and Control, Vol. 4, No 2, 2026 |
Driver Drowsiness Detection and Warning System Using Computer Vision and Neural Networks on
Embedded Platforms
Chi-Phat Pham 1, Quang Tran 2,*, Binh-Hau Nguyen 3, Van-Dong-Hai Nguyen 4, Thi-Hong-Lam Le 5, Ngoc-Hung Nguyen 6, Van-Hiep Nguyen 7, Thanh-Binh Nguyen 8, Thi-Ngoc-Thao Nguyen 9, Hoang-Lam Le 10
1, 2, 4, 5, 6, 7, 8, 9, 10, 11 Ho Chi Minh City University of Technology and Engineering (HCM-UTE), Ho Chi Minh City (HCMC), Vietnam
3 Posts and Telecommunications Institute of Technology (PTIT), Ho Chi Minh City (HCMC), Vietnam
Email: 1 20119191@student.hcmute.edu.vn, 2 quangtran190590@gmail.com, 3 haunb@ptit.edu.vn,4 hainv@hcmute.edu.vn,
5 lamlth@hcmute.edu.vn, 6 hungnn@hcmute.edu.vn, 7 hiepnv@hcmute.edu.vn, 8 binhnt@hcmute.edu.vn,
9 thaontn@hcmute.edu.vn, 10 lamlh@hcmute.edu.vn
*Corresponding Author
Abstract—Driver drowsiness is one of the leading causes of traffic accidents worldwide. Traditional monitoring approaches, such as vehicle-based parameter analysis or physiological signal measurement, often require intrusive sensors or deep access to vehicle systems. To overcome these limitations, this paper proposes a real-time driver drowsiness detection and warning system using computer vision combined with a neural network classifier on an embedded platform. Facial landmarks are extracted using the dlib 68-point model, and the Eye Aspect Ratio (EAR) is computed to evaluate eye-closure behavior. A deep neural classifier is trained on eye-state and temporal EAR sequences collected from 25 subjects to classify normal and drowsy conditions. The system is deployed on a Raspberry Pi 3 B+ embedded platform, integrated with an Arduino-based alarm module to deliver audio–visual alerts when drowsiness is detected. Experimental results demonstrate a training accuracy of 98.4% and a testing accuracy of 92.8% with real-time performance of 15–20 FPS under daylight conditions, stable performance in real time, and feasibility for installation in passenger cars, trucks, and buses. The proposed method contributes a low-cost, efficient, and deployable solution for reducing road accidents with a focus on lightweight embedded implementation.
Keywords—Driver Fatigue Detection; Computer Vision; EAR; Deep Learning; Embedded Systems; Raspberry Pi; Neural Networks
Driver drowsiness is widely recognized as one of the leading causes of serious traffic accidents, particularly in long-distance driving, nighttime operation, and monotonous driving environments. Fatigue and reduced alertness significantly degrade drivers’ reaction time, perception, and decision-making ability, thereby increasing crash risk and accident severity [1], [2]. Despite continuous improvements in vehicle safety technologies, driver drowsiness remains difficult to detect and prevent in real time, making it a critical problem that requires effective and practical technological solutions. Existing driver drowsiness detection approaches can generally be classified into vehicle-based, physiological signal-based, and vision-based methods [1].
Vehicle-based techniques rely on driving behavior such as steering patterns or lane deviation, which often require access to vehicle systems and may vary across different vehicle models. Physiological signal-based methods, including EEG or ECG monitoring, can achieve high detection accuracy but are intrusive, uncomfortable, and impractical for long-term daily use. In contrast, vision-based methods provide a non-contact and non-intrusive solution, making them more suitable for real-world deployment using standard cameras under natural driving conditions [3], [4]. with recent studies exploring deep learning approaches such as CNN and LSTM, achieving accuracy up to 97–99% but requiring higher computational resources [5].
Among vision-based techniques, facial behavior analysis, particularly eye closure duration and blinking patterns, has been shown to be a reliable indicator of driver drowsiness. Metrics such as EAR enable efficient quantification of eye openness using facial landmarks, allowing real-time implementation without complex image processing pipelines [6]. Motivated by these advantages, this study develops a driver drowsiness detection system based on EAR features and a neural network classifier, implemented on a Raspberry Pi platform to achieve a balance between detection accuracy, computational efficiency, and practical feasibility, particularly for low-cost embedded implementation with real-time constraints.
Research on driver drowsiness detection has traditionally followed three methodological directions: vehicle-behavior monitoring, physiological-signal sensing, and vision-based behavioral analysis. Vehicle-based indicators, such as lane deviation and steering-wheel corrections, have been explored as proxies for deteriorating driver alertness but are highly susceptible to road conditions and inter-driver variability, reducing their reliability as standalone measures [7]. Physiological sensing approaches employing EEG, ECG, and EOG provide more direct indicators of fatigue yet require intrusive electrodes and specialized equipment, limiting practicality for deployment in commercial vehicles [8]. For these reasons, recent literature - along with domestic studies summarized in the thesis - has increasingly converged on vision-based methods that infer fatigue through observable ocular and facial dynamics such as eyelid closure rate, blink duration, yawning, and head orientation [9], including recent deep learning-based approaches such as CNN and LSTM, which typically achieve accuracy above 95% but require higher computational resources [5]. This shift is consistent across both research prototypes and commercial platforms.
In Vietnam, early implementations primarily focused on simple computer-vision pipelines, such as Android-based applications detecting eye closure from smartphone cameras or prototype systems built at secondary-education institutions. These systems demonstrate feasibility but suffer from limited robustness: they operate reliably only in daytime illumination, fail when the driver rotates the head beyond approximately 40–60°, and lack the computational headroom required for more advanced models [10]. In contrast, international automotive manufacturers - including Hyundai (DDREM) and Audi - have deployed production-grade driver monitoring systems that combine infrared (IR) imaging with embedded algorithms to track eyelid closure continuously in real time, even under variable lighting conditions. While these systems demonstrate the industrial viability of fatigue detection, their proprietary nature and high hardware cost prevent broad research replication.
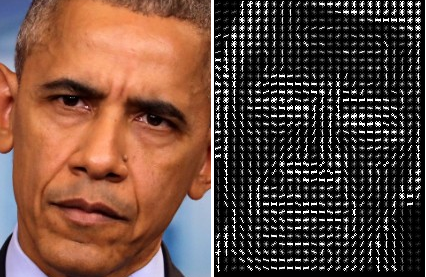
Fig. 1 illustrates the main processing stages of a typical vision-based face recognition system, including face detection, preprocessing, feature extraction, and classification. Complementing these applied efforts, numerous foundational vision techniques have shaped modern fatigue-detection pipelines. Classical appearance-based face analysis, such as Eigenfaces and Fisherfaces, demonstrated early success but performed poorly under illumination shifts and non-frontal poses. More robust local-descriptor approaches, including Local Binary Patterns, Gabor-based filters, and the widely adopted Histogram of Oriented Gradients (HOG)-have shown superior discrimination in real-time face detection applications. HOG combined with a linear Support Vector Machine (SVM) remains one of the most stable detectors for embedded systems due to its balance between computational efficiency and robustness. To enable fine-grained ocular analysis, contemporary systems employ facial landmark regression, most notably the 68-point ensemble regression tree model, which reliably localizes eye regions for geometric feature extraction. The Eye Aspect Ratio (EAR), derived from these landmarks, has emerged as a lightweight and discriminative metric for differentiating open, blinking, and sustained-closure states [11]. Building on these foundations, the thesis integrates EAR temporal features with an Artificial Neural Network (ANN), leveraging temporal dynamics of eyelid behavior to classify driver alertness while maintaining real-time performance on low-power hardware such as the Raspberry Pi 3B+ [12].
Histogram of Oriented Gradients (HOG) features were originally introduced for human detection but later became widely used for general object detection due to their robustness to illumination and pose variations. The core idea behind HOG is that local object appearance and shape can be effectively characterized by the distribution of intensity gradients or edge directions.
The main steps for computing HOG descriptors are:
Image gradients are computed using simple derivative filters:
| (1) |
Two partial derivative images along the horizontal and vertical directions are computed using the following equations:
| (2) |
Magnitude and orientation are obtained as:
| (3) |
| (4) |
In the gradient computation stage, image gradients are obtained using simple derivative filters, as defined in (1), which approximate horizontal and vertical intensity changes. The partial derivatives in the horizontal and vertical directions are computed according to (2). Based on these derivatives, the gradient magnitude and orientation are calculated using (3) and (4), respectively. These quantities characterize local edge strength and direction, forming the basis for subsequent histogram construction in the HOG descriptor.
Gradient orientations within each cell are quantified into p bins (typically 9 for unsigned HOG, 18 for signed HOG). Each pixel contributes to a bin proportionally to its gradient magnitude.
In the HOG feature extraction process, neighboring cells are grouped into overlapping blocks to enhance local contrast normalization and improve robustness to illumination variations.
| (5) |
The total number of blocks extracted from an image is determined by (5), which depends on the image dimensions, cell size, and block configuration. This formulation reflects the sliding mechanism of blocks across the image with a stride equal to the cell size, allowing each cell to contribute to multiple blocks.
Each block histogram vector is normalized using L1 or L2 normalization to improve robustness against illumination changes, local contrast variations, and shadowing effects commonly encountered in real-world images. This normalization reduces sensitivity to global intensity fluctuations while emphasizing the underlying gradient distribution. Final HOG descriptor is formed by concatenating all normalized block vectors into a single high-dimensional feature representation that effectively captures spatial arrangement of local edge information. Consequently, descriptor preserves important shape and structural characteristics of objects and has been widely applied in face and object detection tasks, as illustrated in Fig. 2.
Following face detection, Fig. 3. The 68-point landmark regression model is used to extract key facial components, including both eyes, eyebrows, nose, and mouth. This model is based on an ensemble of Regression Trees, which has been shown to provide reliable landmark estimation in low-latency applications.
Recent literature supports the suitability of HOG–SVM and landmark regression for embedded driver-monitoring systems due to their high accuracy and computational efficiency.
To quantify the degree of eye openness, the system uses EAR, a geometric metric derived from Euclidean distances between specific pairs of eye landmarks. As illustrated in
Fig. 4, EAR is computed by taking the ratio of the sum of two vertical distances between eyelid landmarks to twice the horizontal distance between the eye corners. This formulation effectively normalizes eye geometry, making the metric invariant to scale changes and moderately robust to head distance variations. When the eye is open, vertical distances remain relatively large, resulting in a higher EAR value; during blinking or sustained eye closure, these distances decrease sharply, causing a significant drop in EAR [13]. Owing to its computational simplicity and discriminative capability, EAR is well-suited for real-time driver monitoring systems operating on resource-constrained embedded platforms due to its low computational cost, as also reported in recent studies [5] in Fig. 4:
The formula for calculating the Eye Aspect Ratio (EAR):
| (6) |
where  –
– denote the six landmark coordinates surrounding one eye. EAR exhibits three desirable properties:
The Eye Aspect Ratio (EAR) is a geometric feature used to quantify eyelid openness based on the relative distances between specific eye landmarks. As defined in Equation (6), EAR is computed as the ratio between the sum of two vertical eye landmark distances and twice the horizontal eye landmark distance, enabling robust discrimination between open, blinking, and closed eye states.
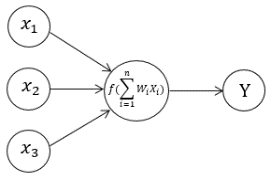
The human brain is a nonlinear, parallel information. An Artificial Neural Network (ANN) is formed by interconnecting many such neurons, with trainable weights that are adjusted during the learning process. Through this mechanism, ANNs can model complex relationships and perform tasks such as pattern recognition and classification.
The fundamental components of an artificial neuron are shown in the Fig. 5 include:
 -dimensional vector.
 , typically initialized randomly and updated during training.
Mathematically, the neuron computes an input function- such as linear, quadratic, or spherical- and applies an activation function  . Common activation functions include step, sign, linear, saturated linear, and sigmoid functions.
Input processing function:
The (7) formulates the linear input function, in which the neuron output is obtained as a weighted linear combination of the input features with an added bias.
| (7) |
The (8) introduces the quadratic input function, extending the linear model by including second-order input terms to enhance nonlinear representation capability.
| (8) |
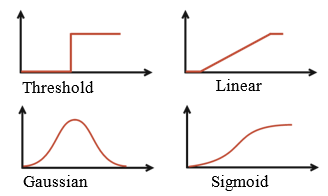
Furthermore, the spherical input function presented in (9) measures the squared Euclidean distance between the input vector and a reference center, scaled by a parameter  , which is particularly useful for modeling radial decision boundaries. Output processing function – Activation function: , including in the Fig. 6.
| (9) |
The full system is optimized for implementation on a Raspberry Pi 3B+ as the primary processing unit, with an Arduino Nano serving as the actuator controller:
This distributed architecture reduces computational load on the Raspberry Pi and ensures stable operation at 15–20 FPS, which is sufficient for real-time fatigue monitoring. The approach aligns with established embedded fatigue-detection prototypes documented in recent literature [12].
Python is a high-level, interpreted, object-oriented programming language featuring dynamic semantics and strong support for modular and reusable code through its extensive module and package system. Originally developed by Guido van Rossum in 1989 as a successor to the ABC language, Python has evolved through major releases, most notably Python 2.0 (2000), which introduced garbage collection and Unicode support, and Python 3.x (2008), which further improved language stability and consistency. Python is widely adopted due to its simple, readable syntax, dynamic typing, robust exception handling, and rich standard library, supported by an extensive ecosystem of third-party packages [14]. Additionally, Python provides strong interoperability with C/C++, Java, and .NET, and can be embedded as a scripting interface within larger applications. As a cross-platform language, Python runs uniformly across Windows, Linux/Unix, macOS, mobile operating systems, and virtual machine environments. Its open-source nature, combined with a large and active developer community, makes Python a powerful and accessible tool for scientific computing, machine learning, and general-purpose programming.
OpenCV is an open-source framework widely used for implementing computer vision and image-processing algorithms across various platforms and programming languages. Developed initially by Intel, OpenCV has grown into a highly optimized toolkit, supporting real-time applications through parallel computation using techniques such as SIMD instructions, CUDA, OpenCL, and multi-core processing [15]. The library provides a broad range of modules from basic matrix operations and filtering to feature detection, object recognition, and machine learning, making it suitable for both research and industrial applications. In this work, OpenCV is utilized mainly for image preprocessing, including loading datasets, handling video streams, cropping regions of interest, and preparing data for model training.
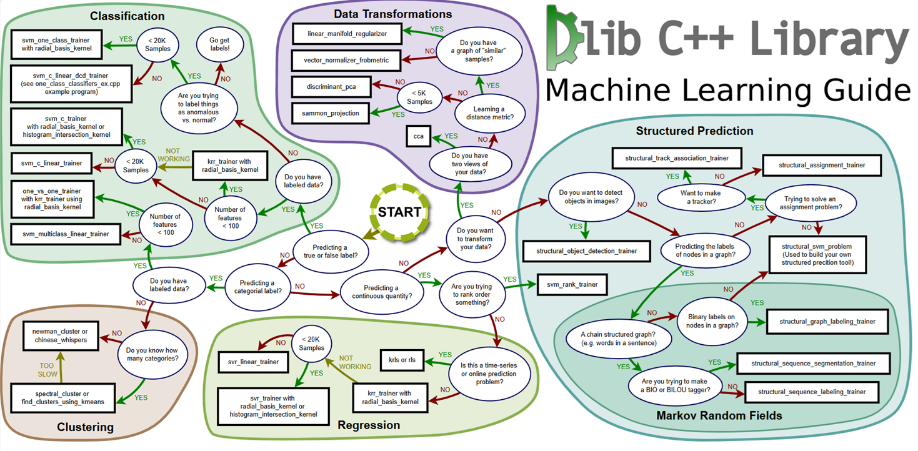
dlib is an open-source machine learning library designed for building robust AI and pattern-recognition systems. Unlike OpenCV, which emphasizes visual computing, dlib focuses on ML-oriented tools such as classification, clustering, regression, structured prediction, and data transformation. In this study, dlib is employed to detect and align facial images using pre-trained models - including HOG + SVM for face detection and the 68-point facial landmark predictor to ensure consistent and accurate feature extraction for subsequent processing tasks [16].
The dlib library is a comprehensive machine learning and computer vision framework that provides a wide range of algorithms for data analysis and pattern recognition. As illustrated in Fig. 7, dlib is organized into several major functional modules, including classification, regression, clustering, data transformations, structured prediction, and Markov Random Fields.
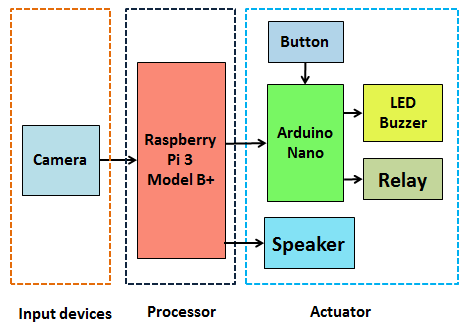
As shown in Fig. 8, The proposed drowsiness warning system consists of a Raspberry Pi 3 Model B+, an Arduino Nano, a Logitech C170 camera, SSR relay modules, LEDs, and control buttons. The Raspberry Pi acquires image data, performs face detection using HOG–SVM techniques, extracts facial landmarks via the dlib framework, computes the Eye Aspect Ratio (EAR), and determines the driver’s drowsiness state using a trained model [17]. When drowsiness is detected, an audible alert is generated, and control signals are transmitted to the Arduino via serial communication. The Arduino activates visual and acoustic warnings and controls relay modules for auxiliary alert devices.
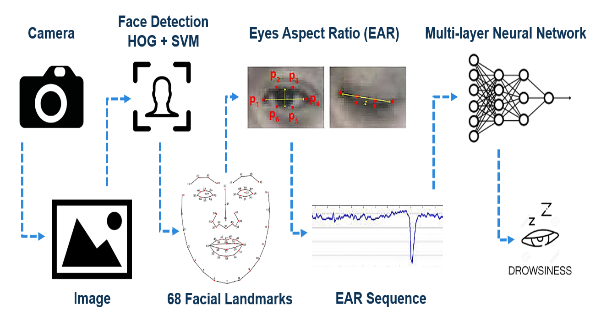
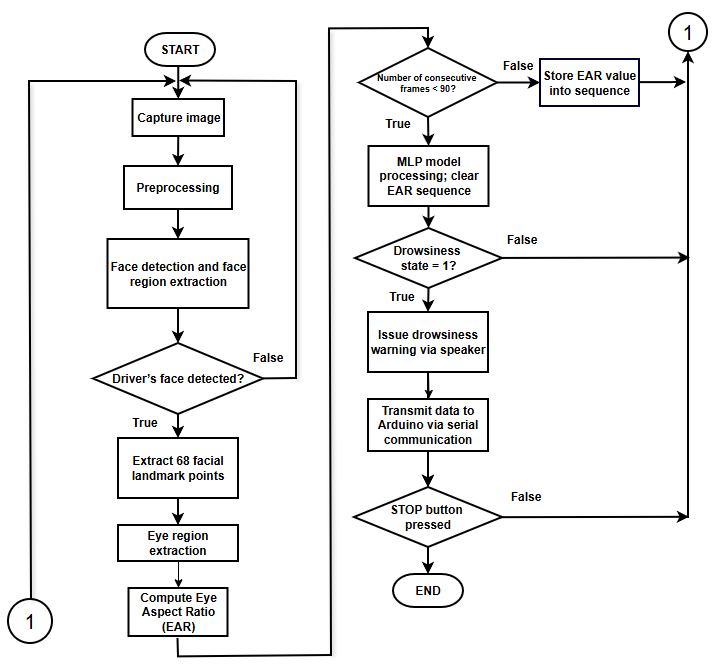
According to Fig. 9, the system workflow is carried out through several sequential steps. The images captured from the camera are first processed by a face detection module based on Histogram of Oriented Gradients (HOG) features combined with a Support Vector Machine (SVM) classifier. Once a human face is detected, the facial region is cropped and further analyzed to extract 68 facial landmark points using a regression-tree-based method. Based on these landmarks, the coordinates of the left and right eyes are determined, and EAR is computed to quantify the degree of eye openness. The EAR values are continuously recorded over time until a predefined number of frames is reached, forming a temporal EAR sequence. This sequence is then used as the input to a multilayer feedforward neural network to classify the driver’s state, a strategy commonly adopted in driver drowsiness detection systems.
Fig. 10 presents the algorithmic flowchart of the Raspberry Pi–based program. After system startup, images captured from the Logitech C170 camera are preprocessed by converting RGB images to grayscale, resizing them to 320 × 200 pixels for real-time performance, and applying local histogram equalization. Face detection is then performed using HOG–SVM techniques, followed by the extraction of 68 facial landmark points using the dlib framework. Based on the detected eye regions, the Eye Aspect Ratio (EAR) is computed to quantify eye openness.
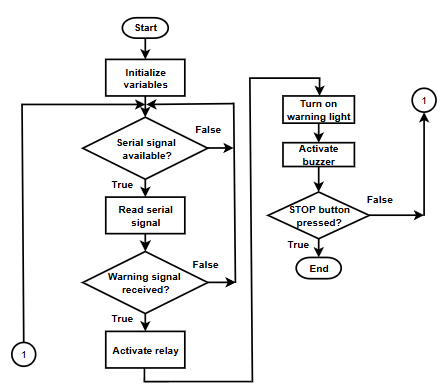
This flowchart is essential for illustrating the overall operational logic of the warning system. Fig. 11 shows the Arduino program operates in an event-driven loop in which serial commands received from the Raspberry Pi control the activation of warning devices. Upon power-up, the Arduino Nano initializes system variables and continuously monitors the serial port. When a message beginning with the keyword “warning” is detected, the Arduino activates the relay modules, warning LEDs, and buzzer, and then returns to the listening state. This design ensures low-latency and reliable operation, consistent with standard Arduino-based serial communication and embedded alert control architectures
The experimental results were obtained from the real-time driver drowsiness detection system implemented on an embedded hardware platform. The experimental setup integrates a Raspberry Pi 3 Model B+ as the main processing unit, an Arduino Uno R3 for peripheral control, and a Logitech C170 camera for real-time image acquisition. The Raspberry Pi is responsible for video processing, feature extraction, and neural network inference, while the Arduino handles actuator control through digital input/output interfaces.
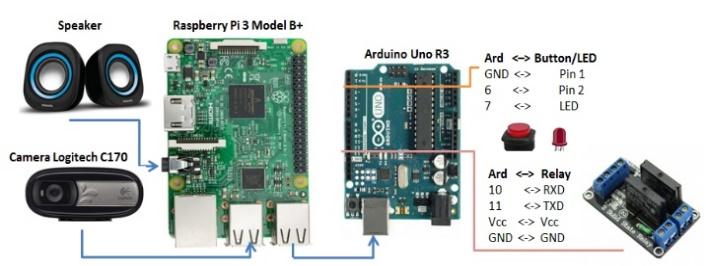
Fig. 12 shows the hardware wiring diagram of the proposed system. A Raspberry Pi 3 Model B+ is used for image acquisition and processing via a Logitech C170 camera, while an Arduino board control warning devices such as LEDs, a speaker, and relay modules through serial communication. This configuration enables reliable real-time operation and effective interaction between the vision-processing and alert-control units.
Table 1 summarizes the hardware wiring connections of the proposed system. The table details connections between Raspberry Pi 3, Arduino board, camera, buttons, LED, and SSR relay modules, specifying corresponding pins and interfaces. This wiring configuration ensures reliable signal transmission and stable operation of the experimental system.
Raspberry Pi 3 | |
Audio (Jack 3.5) | Loa |
USB | Camera Logitech C170 |
Serial Port USB | COM Arduino |
Arduino Uno R3 | |
GND | Button (Pin 1) |
6 | Button (Pin 2) |
7 | LED |
SSR Relay | |
10 | CH1 |
11 | CH2 |
VCC | VCC |
GND | GND |
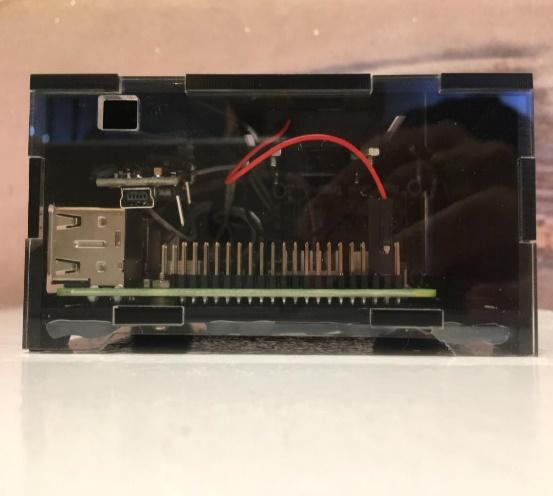
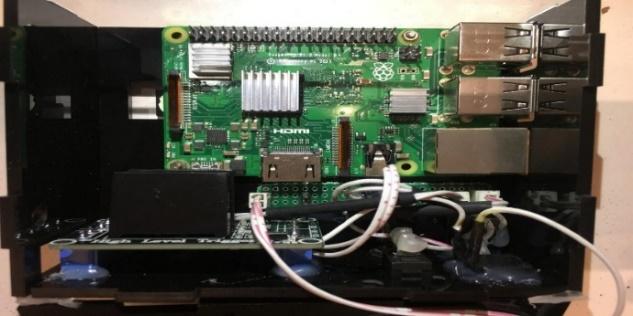
Fig. 13 shows the front view of the driver’s drowsiness warning device. Fig. 14 presents the prototype of the proposed system. As shown in the figure, the hardware components used include a Raspberry Pi 3 Model B+, an Arduino Uno R3, a Logitech C170 camera, SSR relay modules, LEDs, and control buttons. With this configuration, a compact device suitable for in-vehicle installation is realized, featuring overall dimensions of approximately 10 cm × 8 cm × 4.5 cm (length × width × height). The system operates using a 5 V–3 A power supply provided by a vehicle charger
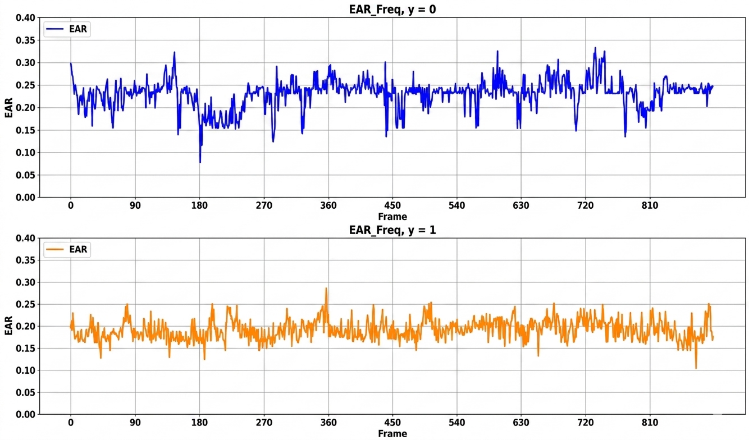
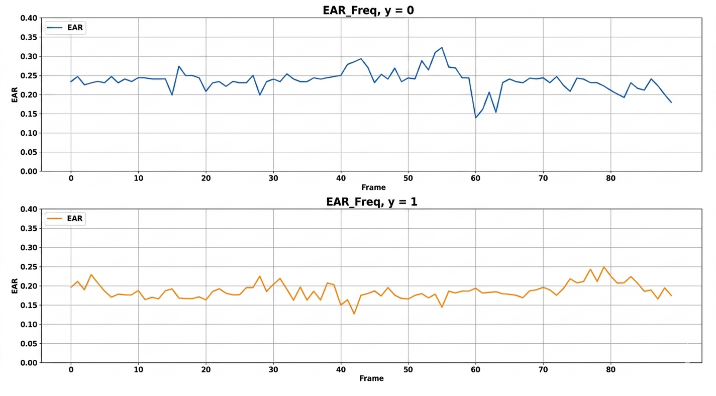
Training data were collected from 25 subjects under daytime lighting conditions, consisting of continuous EAR sequences over 90 consecutive frames for both alert and drowsy states, with corresponding labels. The dataset was divided into training and testing sets using an 80/20 split, where 80% of the data were used for training, and 20% were reserved for testing to evaluate model generalization performance, as illustrated in Fig. 15.
From Fig. 16, it can be observed that:
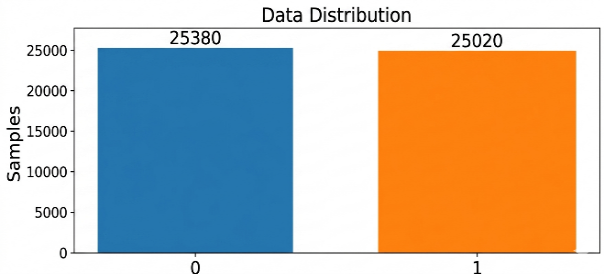
After data collection, the dataset is split into 80% (40,320 samples) for training and 20% (10,080 samples) for testing the neural network, as shown in Fig. 17.
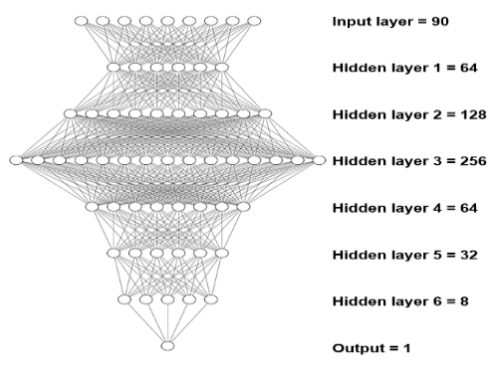
Fig. 18 illustrates the architecture of the neural network used for drowsiness detection, which consists of:
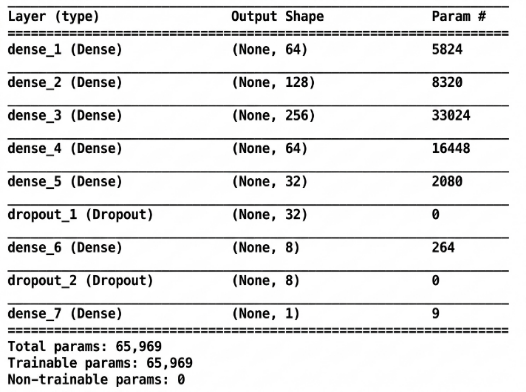
Fig. 19 shows the parameters of the proposed neural network. The network contains a total of 65,969 trainable parameters and was trained on a workstation equipped with an Intel Core i7 CPU and an NVIDIA GeForce GTX 1080 Ti GPU.
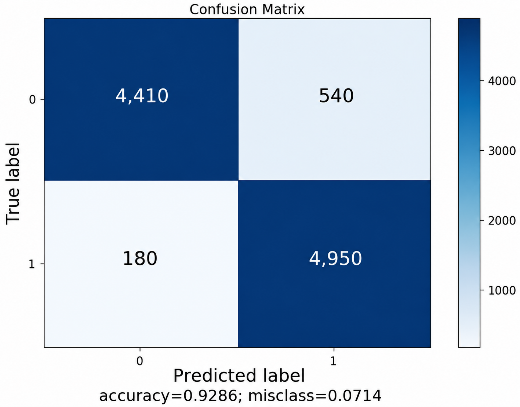
After approximately 4.5 hours of training over more than 5,000 epochs, the proposed model achieved a training accuracy of 98.4%, indicating effective learning and convergence of the network. The testing accuracy reached 92.8%, demonstrating good generalization performance on unseen data. This result suggests a practical trade-off between detection accuracy and computational efficiency for real-time embedded deployment.
The prediction results of the drowsiness states on a total of 10,080 testing samples are summarized in the confusion matrix illustrated in Fig. 20, which provides a detailed analysis of classification performance across different classes.
The camera was fixed while the distance to the driver’s seat and the viewing angle were varied during experiments. Upon system startup, if the driver’s face is detected for 15 consecutive frames, the drowsiness detection function is activated. When drowsiness is detected, visual (red LED), voice (“Warning! The driver is sleepy!”), and audible alerts are triggered. If the driver looks away from the front for 15 consecutive frames, a voice reminder is issued. The system automatically deactivates when no face is detected for 150 consecutive frames. The system maintained stable performance during continuous operation under normal lighting conditions.
When the driver is seated close to the camera, the distance between the driver and the camera is approximately 60 cm, as illustrated in Fig. 21. As a result, the experimental setup provides reliable visual input for real-time drowsiness detection and performance evaluation.
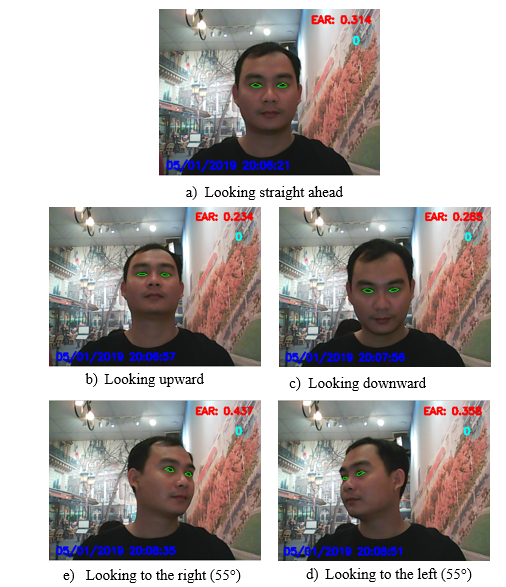
At a distance of 100 cm, when the camera viewing angle varies from −55° to 55°, the Eye Aspect Ratio (EAR) ranges from 0.264 to 0.437. This range corresponds to normal eye-opening behavior during alert driving conditions.
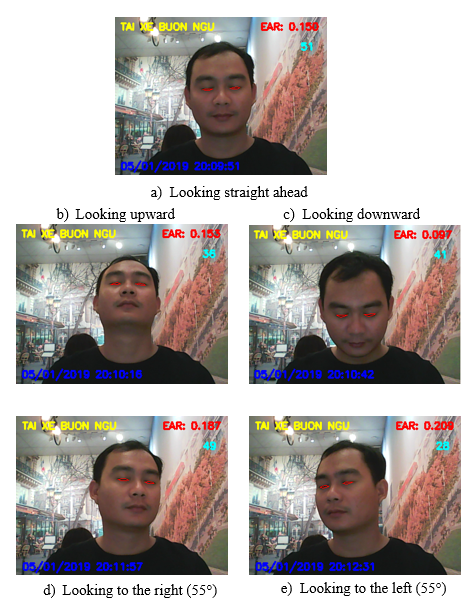
Fig. 22 when the driver is seated close to the camera, the distance between the driver and the camera is approximately 60 cm. At a distance of 60 cm, when the camera viewing angle varies from −55° to 55°, the Eye Aspect Ratio (EAR) ranges from 0.097 to 0.209. This lower range reflects prolonged eye closure and is clearly distinguishable from the alert state. When the driver is seated farther from the camera, the distance between the driver and the camera is approximately 100 cm. In the system configuration, when the eye-opening ratio is lower than 0.22, and eye closure persists for 15 consecutive frames, the system identifies the driver as exhibiting signs of drowsiness.
This paper presented a computer vision–based driver drowsiness detection and warning system. The proposed approach achieved stable performance under daytime conditions and moderate illumination variations by employing Histogram of Oriented Gradients (HOG) features combined with a Support Vector Machine (SVM) classifier for facial and eye-state analysis.
Training the neural network on data collected from multiple drivers significantly improved detection accuracy and reduced subject-dependent bias compared to traditional fixed-frame threshold methods. Once drowsiness is detected, the system provides real-time visual and audio warnings, including a red LED indicator and voice alerts, which effectively enhance driving safety. Furthermore, the compact hardware design enables practical deployment and experimental validation in real vehicle environments [18].
The proposed system demonstrates a practical balance between accuracy and computational efficiency, making it suitable for deployment on low-cost embedded platforms.
Despite encouraging results, the system still faces several limitations. Its performance degrades under low-light or nighttime conditions, and face detection becomes unreliable when the driver’s head rotation exceeds approximately 40°. In addition, the limited computational capability of the Raspberry Pi 3 Model B+ restricts real-time execution of deeper neural network models.
Future work will focus on integrating CNN-based face and eye detection methods, which have been shown to be more robust under complex illumination and pose variations. Extensive in-vehicle experiments and the collection of a larger and more diverse dataset will be conducted to improve model generalization and objectivity. Moreover, deploying the system on GPU-enabled embedded platforms, such as NVIDIA Jetson Nano or Jetson TX2, will enable real-time inference of advanced deep learning models. Additional warning modalities, including smartphone vibration and message-based alerts, will also be explored to further enhance driver interaction and safety.
Chi-Phat Pham, Driver Drowsiness Detection and Warning System Using Computer Vision and Neural Networks on Embedded Platforms