Journal of Fuzzy Systems and Control, Vol. 4, No 1, 2026 |
Imbalance Handling Strategies for Predictive Maintenance Under Leakage-Free Factorial Evaluation
Tedy Rismawan 1,* , Irma Nirmala 2
1, 2 Department of Computer Engineering, Universitas Tanjungpura, Pontianak, Indonesia
Email: 1 tedyrismawan@siskom.untan.ac.id, 2 irma.nirmala@siskom.untan.ac.id
*Corresponding Author
Abstract—Predictive maintenance (PdM) in industrial manufacturing relies on machine learning classifiers trained on severely imbalanced sensor data, where failure events represent a small minority of observations. This study presents a controlled factorial experiment evaluating five algorithms (Decision Tree, Random Forest, SVM, XGBoost, and Logistic Regression) against four imbalance handling strategies (no handling, SMOTE, ADASYN, and class weighting) across binary and six-class failure mode identification tasks on the AI4I 2020 dataset (10,000 observations, 3.39% failure rate), yielding 40 experimental conditions. All oversampling steps were integrated within an ImbPipeline to prevent data leakage across cross-validation folds. Statistical comparisons were conducted via the Friedman test, post-hoc Nemenyi analysis, and one-tailed Wilcoxon signed-rank tests. XGBoost with no handling achieved the highest performance in both tasks (binary F1 = 0.8952; multiclass F1 = 0.6084). Contrary to common practice, no handling method outperformed SMOTE or ADASYN across four of five algorithms in the binary task (Wilcoxon, p = 0.0312), while class weighting improved macro recall from 0.8448 to 0.8908 without significant F1 degradation. Per-class analysis showed that heat dissipation, power, and overstrain failures were reliably detected (F1 > 0.82), while tool wear and random failures remained undetectable. In the multiclass task, ADASYN and XGBoost class weighting were replaced by SMOTE due to instability with extreme minority classes. These findings demonstrate that synthetic oversampling is not universally beneficial for imbalanced PdM data, and that leakage-free experimental design is essential for reliable performance estimation. Practitioners are advised to benchmark no handling and class weighting before applying synthetic oversampling in PdM deployments.
Keywords—Predictive Maintenance; Class Imbalance; Machine Learning; SMOTE; XGBoost; Cross-Validation
The proliferation of sensor-equipped machinery under Industry 4.0 paradigms has enabled data-driven asset management at an unprecedented scale, allowing manufacturing enterprises to transition from reactive repair cycles toward proactive maintenance strategies [1]-[3]. Predictive maintenance (PdM) addresses this challenge by leveraging machine learning (ML) to identify failure precursors in historical sensor data, enabling timely interventions before failure events occur [4]. Despite considerable advances in ML algorithms, a persistent characteristic of operational data continues to challenge reliable deployment: the severe statistical imbalance between failure and normal operating instances.
In PdM datasets, failure events are inherently rare relative to normal operation. The AI4I 2020 Predictive Maintenance Dataset [5], a widely studied benchmark, exemplifies this condition, containing only 339 failure instances among 10,000 observations at an imbalance ratio of approximately 28.5:1. Standard classifiers tend to default toward the majority class under such conditions, achieving high overall accuracy while exhibiting poor sensitivity to the minority failure class [6]. Several strategies have been proposed to address this, including SMOTE [7], ADASYN [8], and cost-sensitive class weighting [9]. A critical but underreported concern is data leakage from premature oversampling: if resampling is applied before the cross-validation loop, synthetic samples may appear in validation folds, causing optimistically inflated performance estimates [10], [11]. Evaluating imbalance handling techniques, therefore, requires that resampling be strictly confined to each training fold via a pipeline object. The effectiveness of synthetic oversampling has also been questioned in recent literature. Tarawneh et al. [12] demonstrated across more than 70 oversampling methods that synthesized minority samples are most likely to actually belong to the majority class, concluding that oversampling in its current forms is unreliable for real-world applications. Susan and Kumar [13] similarly noted that the effectiveness of sampling methods depends on the class discriminatory information in the data, and that a well-defined decision boundary can yield strong minority-class performance even without resampling. Yet this remains largely untested in PdM contexts.
Several prior studies have applied ML to AI4I 2020, yet each leaves important questions unanswered. Matzka [5] did not examine class imbalance handling and compared only two classifiers. Autran et al. [14] extended the benchmark to four algorithms but omitted handling of imbalance and reported only accuracy, which is insufficient for a 28.5:1 imbalanced dataset. Shah et al. [15] reported weighted F1, which assigns disproportionate weight to the majority class on highly imbalanced data. Muhidin et al. [16] applied SMOTE with Random Forest and KNN. Still, they did not report whether resampling was applied within or outside the cross-validation loop, and were restricted to two algorithms and a single technique. No existing work has systematically compared multiple algorithms against multiple imbalance-handling techniques within a single leakage-free framework, nor has it simultaneously evaluated binary and multiclass task formulations.
To address these gaps, this study conducts a controlled factorial experiment spanning five ML algorithms, four imbalance-handling techniques, and two classification tasks, yielding 40 experimental conditions on the AI4I 2020 dataset. All preprocessing and oversampling steps are integrated within an ImbPipeline object to ensure no synthetic instances appear in any validation fold. Binary failure detection and six-class failure mode identification are evaluated simultaneously within a unified framework. Algorithm and technique differences are validated statistically using
the Friedman test with post-hoc Nemenyi analysis, complemented by pairwise one-tailed Wilcoxon signed-rank tests.
This study makes several contributions to the PdM literature. It provides the first leakage-free factorial benchmark, comparing five algorithms and four imbalance-handling techniques, on AI4I 2020. It also provides empirical evidence that no form of handling outperforms synthetic oversampling for most algorithms, a finding that challenges common practice. Finally, binary and multiclass failure mode identification are evaluated together within a single framework, which no prior study on this dataset has employed.
This study addresses four questions: which algorithm performs best across both tasks, which imbalance handling technique improves minority-class recall without overfitting, whether any algorithm-technique combination consistently dominates, and which sensor features matter most for failure prediction. The remainder of this paper is organized as follows: Section II reviews related work; Section III describes the dataset, preprocessing, and experimental design; Section IV presents results across all 40 conditions; Section V discusses findings and limitations; and Section VI concludes the paper.
Predictive maintenance has emerged as a primary application domain for supervised machine learning in industrial settings, where the overarching goal is to map sensor data to failure probability estimates that guide maintenance scheduling decisions [4]. Among classifier families applied to PdM, tree-based ensembles, particularly Random Forest [17] and gradient boosting variants such as XGBoost [18], have consistently demonstrated strong performance on tabular sensor data, attributed to their capacity to model non-linear feature interactions, robustness to feature scaling, and native feature importance estimation [4]. Support Vector Machines with radial basis function kernels [19] and Logistic Regression [20] have also been applied to PdM tasks, though SVM incurs substantially higher computational cost during hyperparameter search, and Logistic Regression is constrained to linear decision boundaries, limiting its applicability when failure signatures emerge from non-linear sensor combinations. Decision Trees serve a valuable role as interpretable baselines against which ensemble methods can be benchmarked. The relative merits of these algorithm families on AI4I 2020 have not been systematically compared under a unified experimental framework before this study.
The class imbalance problem in fault detection has been extensively studied, with mitigation strategies generally categorized into data-level methods and algorithm-level methods [21], [22]. Among data-level approaches, SMOTE [7] generates synthetic minority samples through linear interpolation between a minority instance and one of its k-nearest neighbors, producing novel samples within the convex hull of the minority class. ADASYN extends this adaptively, allocating more synthetic samples to boundary regions where minority instances are most difficult to separate from the majority class. Despite widespread adoption, both methods introduce synthetic data points that may not correspond to physically plausible machine states, particularly when failure boundaries are sharp and deterministic. Algorithm-level approaches, such as class weighting, avoid modifying the training distribution entirely, instead penalizing minority-class misclassification more heavily during optimization [9], [23]. A recurring methodological concern is the premature application of resampling before the cross-validation loop, which causes synthetic instances to appear in validation subsets and produces optimistically biased estimates [10], [11]. Studies that apply oversampling within a pipeline consistently report lower but more reliable cross-validated scores [11], [24], yet many published PdM studies continue to apply oversampling as a global preprocessing step. Beyond leakage concerns, Tarawneh et al. [12] argued more fundamentally that oversampling is unreliable in practice, as synthesized minority samples are most likely to belong to the majority class regardless of the method used.
The AI4I 2020 Predictive Maintenance Dataset [5] simulates 10,000 manufacturing machine cycles with failure events generated from five physical mechanisms: tool wear failure (TWF), heat dissipation failure (HDF), power failure (PWF), overstrain failure (OSF), and random failure (RNF). The original study evaluated Bagged Trees and Decision Trees on binary failure prediction without addressing class imbalance or multiclass failure mode identification.
Autran et al. [14] extended the benchmark to four algorithms and introduced controlled data-quality irregularities, but omitted imbalance handling and reported only accuracy; on a 28.5:1 imbalanced dataset, a trivial majority-class classifier would achieve 96.6% accuracy, making this metric insufficient for evaluating failure detection. Shah et al. [15] reported a per-product-quality analysis that uses weighted F1, which assigns disproportionate weight to the majority class and potentially overstates model utility for failure detection relative to macro-averaged metrics. Muhidin et al. [16] represent the only prior study to apply oversampling on AI4I 2020, reporting a macro F1 of 0.58 with Random Forest combined with SMOTE, but did not report whether resampling was applied within or outside the cross-validation loop, did not compare against a no-handling baseline, and were restricted to two algorithms and a single technique. The existing literature is thus characterized by narrow algorithm coverage, inconsistent evaluation metrics, the absence of systematic comparison of imbalance techniques, and insufficient methodological transparency regarding the cross-validation design. The present study is designed specifically to close these gaps.
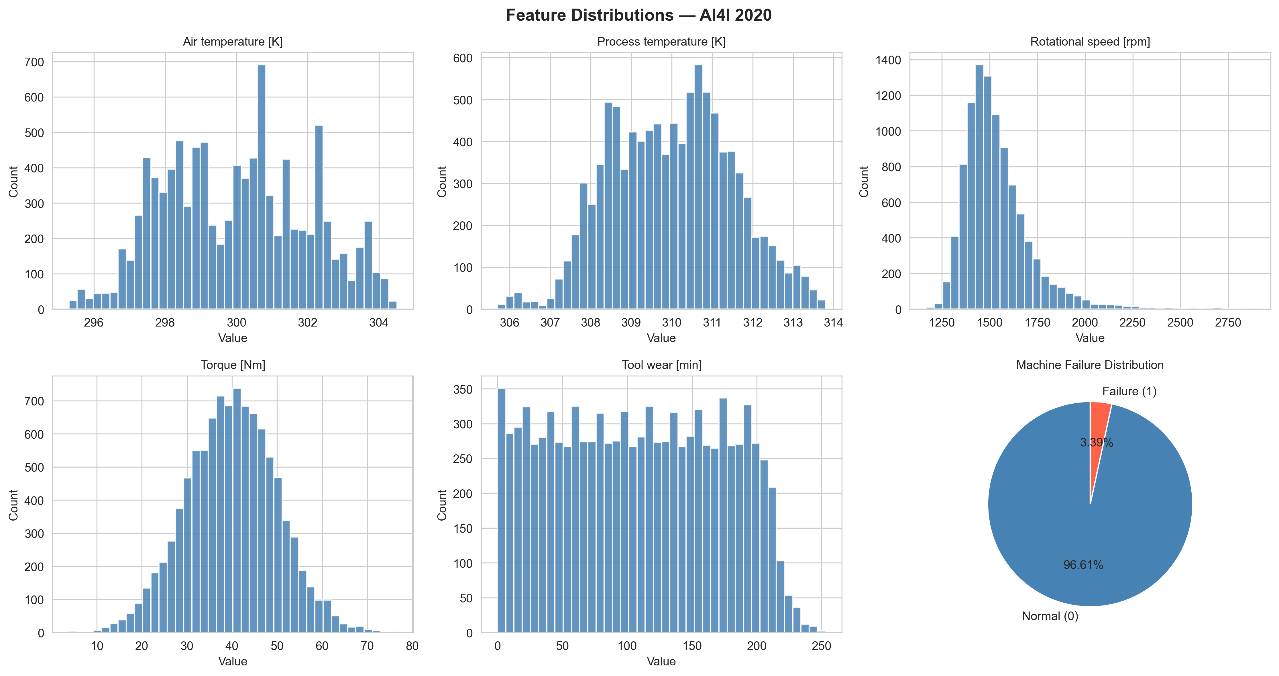
This study employs the AI4I 2020 Predictive Maintenance Dataset [5], available from the UCI Machine Learning Repository. The dataset comprises 10,000 observations simulating continuous industrial machine operation, with failure events generated according to defined physical rules. The dataset contains no missing values or duplicate records. Five numerical sensor features are recorded for each observation, along with one categorical feature (product quality type: L, M, H) and six binary label columns. A full description of all features is provided in Table 1. The distribution of sensor features relative to the failure label is visualized in Fig. 1.
For the binary classification task, the target variable is Machine Failure, yielding 9,661 normal instances (96.61%) and 339 failure instances (3.39%), corresponding to a class imbalance ratio of approximately 28.5:1. Nine instances exhibit an apparent inconsistency in which Machine Failure equals one but no individual failure mode flag is active; consistent with the synthetic generation mechanism described in [5]. These instances were retained and assigned to the no-failure class in the multiclass label via priority-based labeling. Conversely, approximately 18 instances carry an active failure mode flag despite Machine Failure = 0; these were assigned to their corresponding failure mode class in the multiclass label, resulting in a slightly higher total of 348 multiclass failure instances compared to 339 in the binary task (Table 2). The class distributions for both
task formulations are summarised in Table 2 and illustrated in Fig. 2.
Feature | Type | Description | Range | Role |
Type (L/M/H) | Categorical | Product quality grade: Low (50%), Medium (30%), High (20%) | L, M, H | One-hot encoded → Type_H, Type_L, Type_M |
Air Temp. [K] | Numerical | Random walk around 300 K, σ=2 K | ~296–304 K | Feature input |
Process Temp. [K] | Numerical | Random walk, σ=1 K; correlated with air temp. (+10 K offset) | ~306–314 K | Feature input |
Rot. Speed [rpm] | Numerical | Derived from 2860 W power with Gaussian noise | ~1168–2886 | Feature input |
Torque [Nm] | Numerical | Normal distribution, μ=40 Nm, σ=10 Nm | ~3–77 Nm | Feature input |
Tool Wear [min] | Numerical | Cumulative wear; increment rate varies by quality type | 0–253 min | Feature input |
Machine Failure | Binary | Primary target: 0=normal, 1=any failure active | 0, 1 | Target — binary task |
TWF/HDF/PWF/OSF/RNF | Binary | Failure mode flags; used only to construct a multiclass label | 0, 1 | Target source — multiclass task |
Task | Class | Failure Mode | Count | Proportion |
Binary | 0 | Normal operation | 9,661 | 96.61% |
Binary | 1 | Any failure | 339 | 3.39% |
Multiclass | 0 | No Failure | 9,652 | 96.52% |
Multiclass | 1 | TWF — | 46 | 0.46% |
Multiclass | 2 | HDF — Heat Dissipation | 115 | 1.15% |
Multiclass | 3 | PWF — Power Failure | 91 | 0.91% |
Multiclass | 4 | OSF — | 78 | 0.78% |
Multiclass | 5 | RNF — Random Failure | 18 | 0.18% |
Two identifier columns (UDI and Product ID) were removed before analysis. The categorical feature Type was transformed into three binary indicator features (Type_H, Type_L, Type_M) via one-hot encoding. The five individual failure mode flag columns (TWF, HDF, PWF, OSF, RNF) were excluded from the feature matrix because they contain label information that would introduce target leakage. The final feature set comprised eight variables: five numerical sensor readings and three binary quality-type indicators. Temporal feature engineering was not pursued because the dataset lacks timestamps or explicit cycle ordering beyond the UDI index, and its synthetic generation mechanism does not guarantee meaningful sequential dependencies between consecutive observations.
A six-class multiclass label was constructed from the five binary failure mode flags using a priority-based labeling scheme to resolve the 24 instances that exhibit simultaneously active failure modes. The priority order was defined by operational criticality: TWF (class 1) > HDF (class 2) > PWF (class 3) > OSF (class 4) > RNF (class 5), with instances exhibiting no active failure mode assigned to class 0. The resulting multiclass label distribution is visualized in Fig. 3.
The Pearson correlation structure among the five numerical sensor features is presented in Fig. 4, revealing a strong negative correlation between rotational speed and torque (r = −0.88) and moderate positive correlations between air and process temperature, consistent with the dataset's generation mechanism.
The dataset was partitioned into a training set (80%, n = 8,000) and a held-out test set (20%, n = 2,000) using a single stratified split on the binary target variable. Stratification was applied to the binary rather than multiclass label because the smallest failure mode class (RNF, n = 18) contained insufficient instances to ensure representation across all cross-validation folds under six-class stratification.
Feature scaling was withheld at this stage and applied inside the ImbPipeline on each training fold, as described in Section III-C.
The experiment follows a factorial design spanning five ML algorithms, four imbalance-handling techniques, and two classification tasks, yielding 40 experimental conditions, as summarised in Table 3. Due to implementation substitutions in the multiclass task, ADASYN results are identical to SMOTE for all algorithms, and Class Weight results are identical to SMOTE for XGBoost; the multiclass task therefore effectively compares three distinct approaches: no handling, SMOTE, and class weighting. Each condition is evaluated using five-fold Stratified Cross-Validation embedded within GridSearchCV for simultaneous hyperparameter optimization. A single stratified train/test split was preferred over nested cross-validation because primary comparisons are based on cross-validation F1-scores rather than test set performance alone, and because the computational cost of full nesting across 40 conditions would be prohibitive. The close alignment between CV F1 and test F1 across no-handling conditions (absolute difference ≤ 0.07) further confirms that hyperparameter selection does not introduce meaningful optimism bias. For the multiclass task, StratifiedKFold stratification is applied on the binary target label rather than the multiclass label, consistent with the train/test split rationale in §III.B, to ensure failure instances appear in every fold despite the extreme scarcity of minority classes such as RNF. The macro F1-score serves as the optimization criterion throughout, reflecting its equal weighting of all classes regardless of class frequency.
Algorithm | Imbalance Technique | ImbPipeline Structure | Total Fits |
Decision Tree (DT) | No Handling | StandardScaler then DT | 24 combos × 5 = 120 |
Random Forest (RF) | SMOTE | StandardScaler then SMOTE(k=3) then Classifier | 4 combos × 5 = 20 |
SVM | ADASYN | StandardScaler then ADASYN(k=3) then Classifier | 2 combos × 5 = 10 |
XGBoost | Class Weight | StandardScaler then Classifier(cw=balanced) | 4 combos × 5 = 20 |
All 40 conditions use ImbPipeline from the imbalanced-learn library rather than the standard scikit-learn Pipeline. This distinction is operationally critical: ImbPipeline ensures that resampling steps are applied only during the fit phase of each training fold and never during the transform phase on validation data. The pipeline comprises two or three named steps depending on the condition: a scaler step (StandardScaler), an optional resampler step (SMOTE or ADASYN), and a model step containing the classifier. The best estimator identified by GridSearchCV is retained for evaluation on the held-out test set, ensuring that predictions on raw test data correctly invoke the pipeline's scaling transformation.
Two substitutions were applied to maintain experimental validity across all conditions. First, ADASYN was replaced with SMOTE (k_neighbors = 3) for all multiclass task conditions, because ADASYN's adaptive density estimation is unstable for classes with very few training instances, particularly RNF, which has approximately 14 training instances following the 80/20 split. Second, the XGBoost class-weight condition for the multiclass task was replaced with SMOTE (k_neighbors = 3). Although per-class weighting via sample_weight in the fit method is technically feasible, it was not implemented to maintain a uniform pipeline structure across all algorithms; true class weighting for this XGBoost multiclass condition remains a direction for future work.
Five algorithms were selected to represent a range of model families, from interpretable single models to non-linear ensembles and kernel methods. The hyperparameter search space for each algorithm is detailed in Table 4.
Decision Tree (DT) is included as an interpretable baseline, with a grid covering maximum depth (3, 5, 10, and unconstrained), minimum samples per split (2, 5, and 10), and splitting criterion (Gini impurity and information gain), yielding 24 candidate configurations. Random Forest (RF), applied in prior AI4I 2020 studies alongside other classifiers [14], [16] combines bootstrap aggregation with random-feature subsampling; its grid covers the number of estimators (100 and 200), maximum depth (10 and unconstrained), and square-root feature selection, yielding four configurations. Support Vector Machine (SVM) with a radial basis function kernel is included for its strong margin-based generalization guarantees [19]; probability estimation is enabled to support AUC-ROC computation, and the grid spans regularisation parameter C (1 and 10) with fixed kernel and scale-based gamma, yielding two configurations. XGBoost [18] is configured with task-appropriate objectives (binary logistic for the binary task and softmax probability for the multiclass task), with a grid covering a number of estimators (100 and 200), maximum depth (3 and 5), and a fixed learning rate of 0.1, yielding four configurations. Logistic Regression (LR) provides a linear probabilistic baseline; the grid covers regularisation strength C (0.01, 0.1, 1, and 10) and solver choice (lbfgs and saga) with a maximum iteration limit of 1,000, yielding eight configurations.
Algorithm | Parameter | Values | Combos | Fits/condition |
Decision Tree | max_depth | {3, 5, 10, None} | 24 | 120 |
min_samples_split | {2, 5, 10} | |||
criterion | {gini, entropy} | |||
Random Forest | n_estimators | {100, 200} | 4 | 20 |
max_depth | {10, None} | |||
max_features | {'sqrt'} | |||
SVM | C | {1, 10} | 2 | 10 |
kernel | {'rbf'} | |||
gamma | {'scale'} | |||
XGBoost | n_estimators | {100, 200} | 4 | 20 |
max_depth | {3, 5} | |||
learning_rate | {0.1} | |||
Logistic Regression | C | {0.01, 0.1, 1, 10} | 8 | 40 |
solver | {lbfgs, saga} |
Four imbalance-handling strategies were evaluated: no intervention, synthetic oversampling, adaptive oversampling, and cost-sensitive weighting. The no-handling condition serves as the reference baseline, with the ImbPipeline containing only StandardScaler and the classifier. An effective imbalance handling strategy is expected to yield a statistically significant improvement over this baseline; conditions that fail to do so provide evidence that augmentation is unnecessary or harmful for the algorithm in question.
SMOTE [7] generates synthetic minority samples by linearly interpolating between a minority instance and one of its k-nearest neighbors, both drawn exclusively from the minority class. A reduced neighborhood size of k = 3 is used for both binary and multiclass conditions, rather than the default k_neighbors = 5, to accommodate the small RNF class, which has approximately 14 training instances after the 80/20 split. Although k_neighbors = 5 is feasible for the binary task, given its 271 minority training instances, k_neighbors = 3 was applied uniformly across both tasks for consistency. The effect of this choice on binary SMOTE performance relative to k_neighbors = 5 was not separately evaluated and represents a limitation of the current design. ADASYN [8] extends this framework adaptively, generating proportionally more synthetic samples in boundary regions where minority instances are most difficult to separate; n_neighbors = 3 is used. As described in Section III-C, ADASYN is applied only in binary task conditions and substituted with SMOTE for multiclass conditions. The class-weight condition does not modify the training data distribution; instead, class_weight = balanced is passed to the classifier constructor, causing the optimization objective to weight each misclassification penalty inversely proportional to class frequency.
The macro-averaged F1-score is the primary evaluation metric because it assigns equal weight to each class regardless of class frequency, making it robust to severe imbalance. Macro recall is reported as a co-primary metric given its particular relevance to PdM applications, where a false negative, a missed failure event, carries substantially higher operational cost than a false positive [9], [23] AUC-ROC is reported as a class-order-independent discriminative measure; for binary classification, the positive-class probability is used, while for multiclass classification, the one-versus-rest macro-averaged formulation is applied. Macro precision and overall accuracy are reported for completeness. However, accuracy is reported as unreliable for imbalanced datasets, as a classifier that predicts only the majority class achieves 96.6% accuracy on AI4I 2020 without detecting a single failure instance.
Overfitting is quantified per condition as the difference between the mean training F1 and the mean cross-validation F1 for the best hyperparameter configuration identified by GridSearchCV. A gap exceeding 0.10 is used as a practical threshold to flag conditions for further discussion, rather than as a definitive criterion for model rejection. Several limitations of this experimental design should be acknowledged. The study relies on a single synthetic dataset, limiting generalization to real-world sensor data. The fixed k_neighbors = 3 for SMOTE and ADASYN was not subjected to sensitivity analysis. Hyperparameter tuning was performed via non-nested cross-validation, and no temporal feature engineering was applied despite potential sequential dependencies in the sensor readings
All statistical comparisons are conducted on per-fold cross-validation F1-scores extracted from GridSearchCV for the best hyperparameter configuration in each condition, following the framework proposed by [25]. The Friedman test is applied first to detect whether a significant overall performance difference exists among the five algorithms for each imbalance technique and task combination, treating per-fold CV scores as repeated measures across the five folds. Following a common adaptation of the Demšar framework to single-dataset settings, per-fold scores serve as observations; these are not strictly independent due to shared training subsets across folds, and statistical results should therefore be interpreted as indicative rather than confirmatory. A significance threshold of α = 0.05 is applied throughout. Following a significant Friedman result, post-hoc pairwise comparisons are conducted using the Nemenyi test, which controls the familywise error rate for multiple comparisons.
The Wilcoxon signed-rank test is used for directed pairwise comparisons against the no-handling baseline and for cross-algorithm comparisons at equivalent technique settings. These pairwise tests are presented without correction for multiple comparisons; the Nemenyi post-hoc analysis, which controls the familywise error rate, serves as the primary inferential basis for cross-condition claims. The Wilcoxon results are therefore interpreted as corroborating evidence rather than independent significance tests. The one-tailed formulation is adopted because the hypothesis is directional for technique comparisons, where no handling is hypothesized a priori to perform no worse than oversampling-based alternatives. For cross-algorithm comparisons, the direction of the hypothesis is informed by observed results. It should therefore be interpreted with greater caution, and because with n = 5 cross-validation folds, the minimum attainable two-tailed p-value is 2/2⁵ = 0.0625, which exceeds the 0.05 threshold, making it mathematically impossible to reject the two-tailed null hypothesis at α = 0.05 regardless of the magnitude of the observed difference. The one-tailed minimum of 1/32 = 0.03125 is achievable when all five fold differences are in the same direction. It should be noted that fold-level scores are extracted post-hyperparameter selection, as the same fold scores inform both the selection of the best configuration and the subsequent Wilcoxon comparisons; a small optimism bias in per-fold estimates, therefore, cannot be excluded.
This section reports results across all 40 experimental conditions (5 algorithms × 4 imbalance handling techniques × 2 classification tasks). All performance metrics are computed on the held-out test set (n = 2,000) unless stated otherwise. Cross-validation F1-scores are derived from per-fold scores extracted from GridSearchCV for the best hyperparameter configuration in each condition.
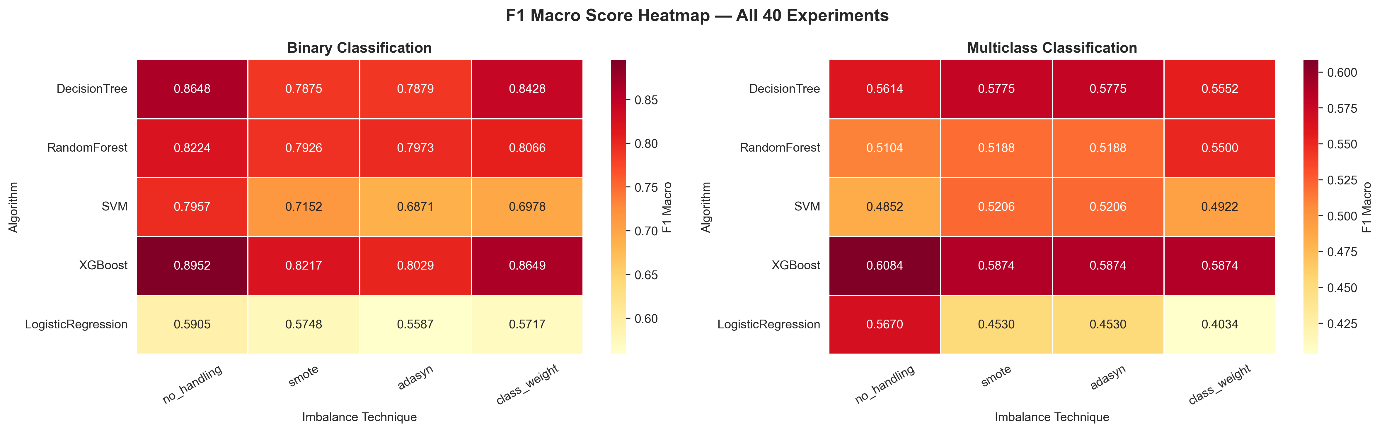
The macro F1-scores achieved across all 20 binary classification conditions are summarised in Table 5. A heatmap visualization of F1-macro scores across all 40 conditions is presented in Fig. 5.
Algorithm | No Handling | SMOTE | ADASYN | Class Weight | Mean |
Decision Tree | 0.8648 | 0.7875 | 0.7879 | 0.8428 | 0.8207 |
Random Forest | 0.8224 | 0.7926 | 0.7973 | 0.8066 | 0.8047 |
SVM | 0.7957 | 0.7152 | 0.6871 | 0.6978 | 0.7240 |
XGBoost | 0.8952 | 0.8217 | 0.8029 | 0.8649 | 0.8462 |
Logistic Regression | 0.5905 | 0.5748 | 0.5587 | 0.5717 | 0.5739 |
Mean | 0.7937 | 0.7384 | 0.7268 | 0.7568 | — |
XGBoost with no handling achieves the highest test F1-macro of 0.8952 across all 20 binary conditions, accompanied by an accuracy of 0.9880, macro precision of 0.9646, macro recall of 0.8448, and AUC-ROC of 0.9746. The 95% confidence interval for its cross-validation F1 is [0.829, 0.879], among the narrowest across all binary conditions. Across all five algorithms, no handling yields the highest mean test F1 (0.7937), followed by class weighting (0.7568), SMOTE (0.7384), and ADASYN (0.7268). No handling yields the highest mean F1 consistently across all five algorithms. The ranking of the remaining techniques varies by algorithm: class weighting ranks second for XGBoost, DT, and RF, whereas SMOTE outperforms class weighting for SVM and LR. Logistic Regression produces substantially lower F1 across all conditions (mean 0.5739), though its AUC-ROC of 0.8998 under no handling indicates reasonable class-ordering ability despite poor threshold-based classification performance. The ROC curves for the top-performing binary models are presented in Fig. 6.
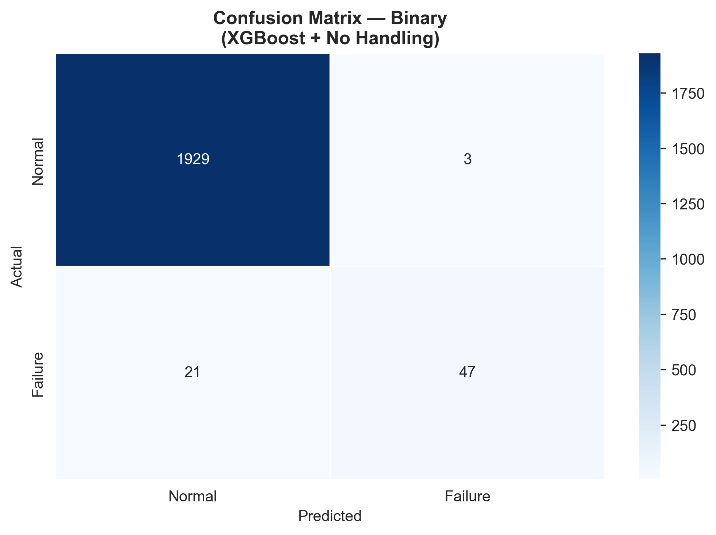
The confusion matrix of the best-performing binary model, XGBoost with no handling, is presented in Fig. 7. The model yields TN = 1,929, FP = 3, FN = 21, and TP = 47 on the test set. The false positive rate is exceptionally low at 0.16%, while the false negative rate is 30.9%, indicating that approximately one in three actual failures is not detected. The per-class F1 decomposition yields F1 = 0.9938 for the normal class and F1 = 0.7966 for the failure class, the macro average of which yields 0.8952.
The macro F1-scores across all 20 multiclass conditions are summarised in Table 6. Multiclass F1-macro scores are substantially lower than their binary counterparts across all conditions, reflecting the inherent difficulty of six-class failure mode identification under severe inter-class imbalance.
XGBoost with no handling achieves the highest multiclass F1 (0.6084), accompanied by an accuracy of 0.9870, macro recall of 0.6018, and AUC-ROC of 0.8977. All three remaining XGBoost conditions yield identical F1 scores of 0.5874 because they were all substituted with the same SMOTE (k = 3) configuration as described in Section III-C. No handling yields the highest mean F1 across algorithms for the multiclass task (0.5465), with SMOTE and ADASYN tied at 0.5315 and class weighting lowest at 0.5176. The narrower spread between techniques in the multiclass setting (range = 0.029) compared to the binary (range = 0.067) suggests that task difficulty diminishes the relative impact of imbalance-handling choices.
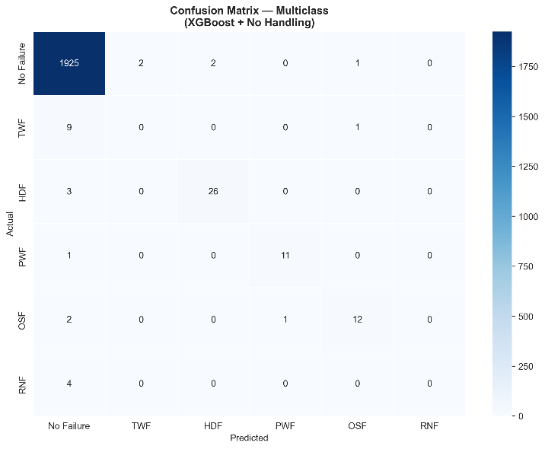
The per-class F1 breakdown of the best multiclass model is presented in Table 7, and the corresponding confusion matrix is shown in Fig. 8.
Algorithm | No Handling | SMOTE | ADASYN | Class Weight | Mean |
Decision Tree | 0.5614 | 0.5775 | 0.5775 | 0.5552 | 0.5679 |
Random Forest | 0.5104 | 0.5188 | 0.5188 | 0.5500 | 0.5245 |
SVM | 0.4852 | 0.5206 | 0.5206 | 0.4922 | 0.5047 |
XGBoost | 0.6084 | 0.5874 | 0.5874 | 0.5874 | 0.5927 |
Logistic Regression | 0.5670 | 0.4530 | 0.4530 | 0.4034 | 0.4691 |
Mean | 0.5465 | 0.5315 | 0.5315 | 0.5176 | — |
Class | Failure Mode | F1 | Precision | Recall | n_test | n_predicted |
0 | No Failure | 0.9938 | 0.9902 | 0.9974 | 1,930 | 1,944 |
1 | TWF — Tool Wear Failure | 0.0000 | 0.0000 | 0.0000 | 10 | 2 |
2 | HDF — Heat Dissipation | 0.9123 | 0.9286 | 0.8966 | 29 | 28 |
3 | PWF — Power Failure | 0.9167 | 0.9167 | 0.9167 | 12 | 12 |
4 | OSF — Overstrain Failure | 0.8276 | 0.8571 | 0.8000 | 15 | 14 |
5 | RNF — Random Failure | 0.0000 | 0.0000 | 0.0000 | 4 | 0 |
Three failure modes, HDF (F1 = 0.9123), PWF (F1 = 0.9167), and OSF (F1 = 0.8276), were reliably detected, exhibiting high per-class F1 scores. Classes TWF (n_test = 10) and RNF (n_test = 4) receive F1 = 0.0000 in both cases; the model fails to predict either class correctly. For RNF, the model makes zero predictions across the entire test set. SVM exhibits an intriguing dissociation between F1 and AUC-ROC in the multiclass task: despite modest F1
values (0.4852–0.5206), it achieves AUC-ROC of 0.9117–0.9357, suggesting effective class separation in probability space but suboptimal discrete label assignment under severe imbalance
Averaged across all five algorithms, no handling yields the highest mean test F1-macro in both binary (0.7937) and multiclass (0.5465) tasks. The superiority of no handling over SMOTE and ADASYN is statistically confirmed for four of the five algorithms in the binary task (Wilcoxon one-tailed, p = 0.0312 for Decision Tree, Logistic Regression, SVM, and XGBoost). The exception is Random Forest, for which no handling is not significantly better than any technique (p > 0.09 for all binary and multiclass comparisons). The magnitude of these differences is large for most algorithms: Cohen's d exceeds 2.0 for XGBoost, Decision Tree, SVM, and Logistic Regression when comparing no handling against SMOTE and ADASYN in the binary task, indicating practically meaningful rather than merely statistically detectable differences. Random Forest is the exception, with d = −0.05 against SMOTE, consistent with its non-significant Wilcoxon result. In the multiclass task, Wilcoxon tests confirm that no handling significantly outperforms SMOTE and ADASYN only for Logistic Regression (p = 0.0312), and outperforms class weighting for both Logistic Regression and SVM (p = 0.0312). XGBoost with class weighting achieves the second-highest binary F1 (0.8649) and is not significantly different from no handling (Wilcoxon p = 0.2188), while markedly improving recall (0.8908 vs. 0.8448).
The Friedman test detects a significant overall difference among the five algorithms in all eight technique-task combinations (all p < 0.01), as reported in Table 8, justifying post-hoc Nemenyi comparisons in every case. Post-hoc Nemenyi analysis reveals that XGBoost significantly outperforms Logistic Regression in every binary classification condition (p = 0.0014–0.0409), and that Decision Tree outperforms Logistic Regression under no handling and ADASYN. No significant difference is identified between XGBoost and Decision Tree, Random Forest, or SVM in any binary condition. In the multiclass task, XGBoost significantly outperforms Random Forest under no handling (p = 0.0227), SVM under no handling (p = 0.0409), and Logistic Regression under SMOTE, ADASYN, and class weight (p = 0.0006–0.0029). The Nemenyi post-hoc p-value matrices for the no-handling condition are visualized in Fig. 9 and Fig. 10. Selected directed pairwise Wilcoxon signed-rank test results are reported in Table 9.
Task | Technique | Friedman χ² | p-value | Significant | Key Nemenyi Pairs (α=0.05) |
Binary | No Handling | 16.640 | 0.0023 | Yes | XGB > LR (p=0.0061); DT > LR (p=0.0061) |
Binary | SMOTE | 18.080 | 0.0012 | Yes | XGB > LR (p=0.0029); RF > LR (p=0.0120) |
Binary | ADASYN | 16.480 | 0.0024 | Yes | XGB > LR (p=0.0409); RF > LR (p=0.0061); DT > LR (p=0.0409) |
Binary | Class Weight | 17.920 | 0.0013 | Yes | XGB > LR (p=0.0014); XGB > SVM (p=0.0409) |
Multiclass | No Handling | 14.080 | 0.0070 | Yes | XGB > RF (p=0.0227); XGB > SVM (p=0.0409) |
Multiclass | SMOTE | 14.400 | 0.0061 | Yes | XGB > LR (p=0.0029) |
Multiclass | ADASYN | 14.400 | 0.0061 | Yes | XGB > LR (p=0.0029) |
Multiclass | Class Weight | 18.080 | 0.0012 | Yes | XGB > LR (p=0.0006); DT > LR (p=0.0409) |
Task | Algorithm | Comparison | CV Mean A | CV Mean B | p-value | Significant |
Binary | XGBoost | No Handling > SMOTE | 0.8538 | 0.8119 | 0.0312 | Yes |
Binary | XGBoost | No Handling > ADASYN | 0.8538 | 0.7936 | 0.0312 | Yes |
Binary | Decision Tree | No Handling > SMOTE | 0.8592 | 0.7769 | 0.0312 | Yes |
Binary | Decision Tree | No Handling > ADASYN | 0.8592 | 0.7823 | 0.0312 | Yes |
Binary | Decision Tree | No Handling > Class Weight | 0.8592 | 0.8207 | 0.0312 | Yes |
Binary | SVM | No Handling > SMOTE | 0.7885 | 0.7170 | 0.0312 | Yes |
Binary | SVM | No Handling > ADASYN | 0.7885 | 0.6989 | 0.0312 | Yes |
Binary | Logistic Reg. | No Handling > SMOTE | 0.6576 | 0.5689 | 0.0312 | Yes |
Binary | Logistic Reg. | No Handling > ADASYN | 0.6576 | 0.5472 | 0.0312 | Yes |
Binary | Random Forest | No Handling > SMOTE | 0.8038 | 0.8054 | 0.6875 | No |
Multiclass | Logistic Reg. | No Handling > SMOTE | 0.5195 | 0.4384 | 0.0312 | Yes |
Multiclass | Logistic Reg. | No Handling > Class Weight | 0.5195 | 0.3947 | 0.0312 | Yes |
Binary | XGBoost | No Handling > Class Weight | 0.8538 | 0.8483 | 0.2188 | No |
Binary | XGBoost vs DT | XGBoost > Decision Tree | 0.8538 | 0.8592 | 0.5938 | No |
Multiclass | XGBoost vs RF | XGBoost > Random Forest | 0.5778 | 0.5041 | 0.0312 | Yes |
Of the 40 experimental conditions, 26 (65%) exhibit an overfitting gap greater than 0.10: 11 of 20 binary conditions and 15 of 20 multiclass conditions. The overfitting pattern is visualised in Fig. 11. Overfitting is concentrated in tree-based models and XGBoost, with SVM also exhibiting moderate overfitting in three multiclass conditions (gap: 0.100–0.107); in 11 of the 26 cases, training F1 equals 1.000, indicating that the optimal hyperparameter configuration includes either unconstrained maximum depth (DT and RF) or sufficient ensemble capacity to fully memorise the training distribution (XGBoost with max_depth=5 and 200 estimators). Critically, the close correspondence between CV F1 and test F1 for no-handling conditions (absolute difference ≤ 0.07 across all algorithms) confirms that the cross-validation scores are valid generalization estimates rather than leakage-inflated figures. Logistic Regression is the sole algorithm exhibiting minimal overfitting across all conditions (training-CV gap ≤ 0.018, with seven of eight conditions at ≤ 0.017), at the cost of substantially lower test F1. Representative conditions exceeding the overfitting threshold are listed in Table 10.
Task | Algorithm | Technique | CV F1 | Train F1 | Gap | Test F1 |
Multiclass | Random Forest | No Handling | 0.5040 | 1.0000 | 0.4960 | 0.5104 |
Multiclass | Random Forest | SMOTE | 0.5270 | 1.0000 | 0.4730 | 0.5188 |
Multiclass | Random Forest | ADASYN | 0.5270 | 1.0000 | 0.4730 | 0.5188 |
Multiclass | Decision Tree | Class Weight | 0.5354 | 1.0000 | 0.4646 | 0.5552 |
Multiclass | Decision Tree | No Handling | 0.5596 | 1.0000 | 0.4404 | 0.5614 |
Multiclass | XGBoost | No Handling | 0.5778 | 1.0000 | 0.4222 | 0.6084 |
Multiclass | Random Forest | Class Weight | 0.4959 | 0.9087 | 0.4128 | 0.5500 |
Multiclass | Decision Tree | SMOTE | 0.5591 | 0.9328 | 0.3737 | 0.5775 |
Multiclass | Decision Tree | ADASYN | 0.5591 | 0.9328 | 0.3737 | 0.5775 |
Multiclass | XGBoost | SMOTE | 0.5985 | 0.8614 | 0.2629 | 0.5874 |
Multiclass | XGBoost | ADASYN | 0.5985 | 0.8614 | 0.2629 | 0.5874 |
Multiclass | XGBoost | Class Weight | 0.5985 | 0.8614 | 0.2629 | 0.5874 |
Multiclass | SVM | SMOTE | 0.5287 | 0.6355 | 0.1068 | 0.5206 |
Multiclass | SVM | ADASYN | 0.5287 | 0.6355 | 0.1068 | 0.5206 |
Multiclass | SVM | Class Weight | 0.4880 | 0.5881 | 0.1001 | 0.4922 |
Binary | Decision Tree | ADASYN | 0.7823 | 1.0000 | 0.2177 | 0.7879 |
Binary | Decision Tree | SMOTE | 0.7769 | 0.9852 | 0.2083 | 0.7875 |
Binary | Random Forest | ADASYN | 0.7992 | 1.0000 | 0.2008 | 0.7973 |
Binary | Random Forest | No Handling | 0.8038 | 1.0000 | 0.1962 | 0.8224 |
Binary | Random Forest | SMOTE | 0.8054 | 1.0000 | 0.1946 | 0.7926 |
Binary | Decision Tree | Class Weight | 0.8206 | 1.0000 | 0.1794 | 0.8428 |
The feature importance rankings for XGBoost with no handling and Random Forest with no handling are presented in Table 11 and visualized in Fig. 12. The top five features are identical across both models: Torque [Nm], Rotational Speed [rpm], Tool Wear [min], Air Temperature [K], and Process Temperature [K]. Torque is the most important feature for both models (XGBoost: 0.2529; RF: 0.3150), consistent with the physical principle that overstrain failure is triggered when the product of torque and tool wear exceeds a threshold [5]. Torque and rotational speed together account for approximately 43% of total feature importance in XGBoost and 55% in Random Forest. The product quality type contributes less than 6% to the overall importance of all three indicator features in either model.
Rank | Feature | XGBoost Importance | Random Forest Importance | Consistent? |
1 | Torque [Nm] | 0.2529 | 0.3150 | Yes ✓ |
2 | Rotational Speed [rpm] | 0.1722 | 0.2310 | Yes ✓ |
3 | Tool Wear [min] | 0.1620 | 0.1680 | Yes ✓ |
4 | Air Temperature [K] | 0.1335 | 0.1340 | Yes ✓ |
5 | Process Temperature [K] | 0.0880 | 0.1210 | Yes ✓ |
6 | Type_M | 0.0804 | 0.0100 | Partial |
7 | Type_L | 0.0563 | 0.0110 | Partial |
8 | Type_H | 0.0548 | 0.0100 | Partial |
XGBoost achieves the highest test F1-macro in both binary (0.8952) and multiclass (0.6084) tasks. Statistical analysis confirms this advantage is significant relative to Logistic Regression in both tasks (Nemenyi p = 0.0061 for binary; p = 0.0006–0.0029 for multiclass), relative to Random Forest in the multiclass task (p = 0.0227), and relative to SVM in the multiclass task (p = 0.0409). However, the performance difference between XGBoost and Decision Tree does not reach statistical significance in either task, indicating that these two algorithms perform equivalently at the cross-validation level despite XGBoost's higher absolute test F1 score. The strong performance of XGBoost is consistent with the broader literature identifying gradient boosting as the leading algorithm for tabular industrial data [26]-[28], and its iterative error-correction mechanism provides an inherent sensitivity to minority-class instances that may partially compensate for class imbalance without explicit oversampling [26], [29] Decision Tree is the most competitive alternative for the binary task, achieving F1 = 0.8648 with no handling and a CV F1 of 0.8592, closely matching its test F1, confirming that the memorized boundaries generalize effectively to unseen data in this synthetic dataset. This result has practical relevance: for tasks where interpretability is a deployment requirement, a single unconstrained Decision Tree may constitute a viable alternative to XGBoost without meaningful sacrifice in predictive performance. Logistic Regression produces the lowest F1 in nearly all conditions, with the notable exception of the multiclass no-handling setting, where SVM (0.4852) and RF (0.5104) rank lower, reflecting the inadequacy of a linear decision boundary for failure signatures emerging from non-linear sensor combinations, though its AUC-ROC of 0.8998 in the binary no-handling condition indicates reasonable class-discriminative ability in probability space. SVM presents a notable dissociation between F1 and AUC-ROC in the multiclass task: despite F1 values of 0.4852–0.5206, AUC-ROC ranges from 0.9117 to 0.9357, suggesting effective class separation in probability space but suboptimal decision boundary placement under severe imbalance [30], [31]. This pattern arises because AUC-ROC measures ranking ability across probability thresholds, while F1 depends on a fixed decision boundary. Under severe imbalance, SVM's margin optimization tends to place the boundary close to the minority class, reducing recall and, consequently, F1, even when the underlying probability estimates correctly rank most instances. Practitioners relying solely on AUC-ROC may therefore overestimate the practical utility of SVMs for failure detection in this setting.
The consistent underperformance of SMOTE and ADASYN relative to no handling, confirmed statistically for four of five algorithms in the binary task (p = 0.0312), challenges the widespread assumption that oversampling is universally beneficial for imbalanced classification [12], [31]. A primary explanation lies in the quality and structure of the available failure instances: the AI4I 2020 dataset contains sufficient discriminative signal in torque and rotational speed that competent non-linear classifiers can learn the failure boundary from the 271 available binary training failure instances without augmentation. The failure modes are deterministically generated from physical rules [5], producing clean, well-separated boundaries for the detectable classes that synthetic interpolation does not improve upon and may marginally corrupt. A secondary explanation is specific to high-capacity models: tree-based models under several conditions reach training F1 = 1.000 (see Table 10), and XGBoost binary no_handling approaches this ceiling (train F1 = 0.987), meaning synthetic samples do not provide access to novel discriminative information but instead increase training complexity, raising variance without reducing bias.
It is important to emphasize that these results describe the behavior of SMOTE and ADASYN when applied correctly within ImbPipeline, without leakage into the validation data. The underperformance, therefore, reflects a genuine property of synthetic oversampling on this dataset rather than methodological error. Random Forest is the notable exception: differences between no handling and all alternative techniques are statistically non-significant (p > 0.09 throughout), consistent with bootstrap aggregation, which already introduces sample-level diversity that partially substitutes for explicit oversampling [6], [29]. Class weighting constitutes the most pragmatically useful alternative: for XGBoost, it achieves binary F1 = 0.8649, not significantly different from no handling (p = 0.2188), while markedly improving macro recall (0.8908 vs. 0.8448), a distinction relevant in deployment contexts where minimizing missed failures is prioritized [9], [32].
The high training F1 values observed for Decision Tree and Random Forest, reaching 1.000 in 11 conditions, may superficially appear to indicate a methodological problem. However, the conjunction of training F1 = 1.000 with CV F1 ≈ test F1 across these same conditions (absolute differences of 0.002–0.031 for no-handling conditions) demonstrates that these values reflect model complexity under the ImbPipeline architecture rather than leakage-induced inflation. Under a naive external oversampling approach, train F1 = 1.000 combined with a high CV F1 would be a diagnostic warning; under ImbPipeline, the same train F1 is simply evidence of a high-capacity model memorizing a clean training distribution, while the CV score faithfully reflects generalization. This distinction reinforces the importance of pipeline-based oversampling as a standard practice for honest evaluation in imbalanced classification research.
The per-class analysis of the best multiclass model reveals a qualitative division among the six failure modes. Three modes, HDF (F1 = 0.9123), PWF (F1 = 0.9167), and OSF (F1 = 0.8276), are reliably detected, exhibiting high per-class F1 scores, attributable to their deterministic multi-sensor generation rules that produce failure instances in a distinct, compact region of the feature space. TWF and RNF receive F1 = 0.0000 from every algorithm-technique combination. The failure of RNF prediction is expected, given only approximately 14 training instances and a generation probability of 0.1% per cycle, independent of all sensor readings [5]; no sensor-based pattern exists to learn for this class. TWF's failure despite 36 training instances likely reflects two compounding factors. First, as the highest-priority class in the labeling scheme, TWF receives all co-occurring instances. Still, the resulting training instances represent edge cases where multiple failure conditions coincide simultaneously. This sensor profile may overlap substantially with adjacent failure modes rather than defining a clean, isolated boundary. Second, with only approximately 37 isolated training instances after the 80/20 split, the effective sample size remains insufficient for non-linear classifiers to learn a reliable TWF-specific decision boundary.
A comparison of this study's results with the four most directly relevant prior studies is presented in Table 12. Muhidin et al. [16] is the most directly comparable prior study, reporting a macro F1 of 0.58 with RF and SMOTE. The best combination in this study achieves a macro F1 of 0.8952, a substantial improvement attributable to three factors: XGBoost outperforms Random Forest for this task, no handling outperforms SMOTE for XGBoost, and leakage-free cross-validation via ImbPipeline provides a more reliable model selection criterion. It should be noted that if Muhidin et al. [16] applied SMOTE outside the cross-validation loop, their reported F1 of 0.58 may itself be an overestimate due to leakage; the true methodological advantage of leakage-free design in the present study would then be correspondingly larger than the absolute difference suggests. The comparison with Shah et al. [15] is complicated by their use of weighted F1 (0.967), which, on a 96.6% majority-class dataset, assigns disproportionate weight to majority-class performance and conveys no meaningful information about minority-class detection capability. Autran et al. [14] report accuracy rather than F1, on a 28.5:1 imbalanced dataset. Accuracy is an uninformative metric, since a trivial majority-class classifier would achieve 96.6% without detecting a single failure, rendering their reported ~0.97 accuracy uninterpretable as evidence of failure-detection capability. To the best of our knowledge, this study is the first to evaluate six-class multiclass failure mode identification on AI4I 2020 under a systematic multi-algorithm, multi-technique factorial design with leakage-free cross-validation, making the reported multiclass F1 of 0.6084 a new methodological baseline for this task formulation.
Study | Algorithm | Imbalance Handling | Primary Metric | Value | Task |
Bagged Trees + DT | None | Not reported | — | Binary | |
XGBoost | None | Accuracy | ~0.97 | Binary | |
Random Forest | None | Weighted F1 | 0.967 | Binary | |
RF + SMOTE | SMOTE | Macro F1 | 0.58 | Binary | |
This Study | XGBoost + No Handling | None | Macro F1 | 0.8952 | Binary |
This Study | XGBoost + No Handling | None | Macro F1 | 0.6084 | Multiclass (6-class) |
The most significant operational limitation is the binary false-negative rate of 30.9%, indicating that approximately one in three actual failures is not detected. Addressing this would require additional labeled training data for underrepresented failure modes, alternative cost functions that penalize false negatives in proportion to their operational costs [9], [23], or threshold optimization strategies. The multiclass task is fundamentally constrained by the unpredictability of the TWF and RNF classes, which together yield an F1 score of 0.0000 across all tested conditions. For RNF, no supervised learning approach operating on the available features can overcome this limitation without additional diagnostic inputs. For TWF, partial recovery may be possible through multi-label classification that preserves co-occurring failure modes rather than discarding them via priority-based labeling.
The dataset is synthetic, meaning failure boundaries are deterministic and likely simpler than those encountered in real industrial sensor data, which is subject to measurement uncertainty and gradual degradation. Empirical validation on operational industrial sensor data is necessary before the algorithmic conclusions of this study can be generalized to deployment contexts. For practitioners deploying PdM systems, these findings suggest a clear evaluation sequence: benchmark no handling first, then class weighting if higher recall is operationally required, and apply synthetic oversampling only when neither approach yields acceptable minority-class performance. Future work should also investigate cost-sensitive learning with explicit failure-cost matrices, deep learning architectures for extracting temporal degradation patterns, SHAP-based explanations of individual failure predictions, and real-world validation on non-synthetic industrial datasets.
This study presented a systematic comparative analysis of five machine learning algorithms across four imbalance-handling techniques and two classification task formulations on the AI4I 2020 Predictive Maintenance Dataset, yielding 40 experimental conditions evaluated under a unified, leakage-free cross-validation framework.
XGBoost achieves the strongest overall performance, though its advantage over Decision Tree is not statistically significant, suggesting that an interpretable single tree is a viable deployment alternative. No imbalance handling consistently outperforms synthetic oversampling, with large effect sizes confirming this is a practically meaningful rather than marginal difference. Class weighting offers the best trade-off when a higher recall is operationally required.
Beyond the direct findings, this study confirms that high training F1 values need not indicate data leakage when oversampling is correctly confined within ImbPipeline. It establishes that heat dissipation, power, and overstrain failures are reliably detectable, whereas tool wear and random failures remain undetectable due to insufficient pattern coverage and extreme sample scarcity. Future work should investigate multi-label classification, cost-sensitive learning with explicit failure-cost matrices, and validation on real-world industrial datasets.
Tedy Rismawan, Imbalance Handling Strategies for Predictive Maintenance Under Leakage-Free Factorial Evaluation