Journal of Fuzzy Systems and Control, Vol. 4, No 3, 2026 |
Electromagnetic Field Assessment of Indonesian 500-kV Double-Circuit Transmission Lines
Using Charge Simulation and Biot-Savart
Methods: Validation, Benchmarking,
and Configuration Evaluation
Warindi Warindi 1,* , Naufal Putra Pradana 2
1, 2 Department of Electrical Engineering, Universitas Sebelas Maret, Surakarta, Indonesia
Email: 1 warindi@staff.uns.ac.id, 2 naufalpradana8822@student.uns.ac.id
*Corresponding Author
Abstract—This paper presents a mesh-free computational framework for assessing power-frequency electric and magnetic fields generated by 500-kV, 50-Hz overhead transmission lines in Indonesia. The framework integrates the Charge Simulation Method (CSM) for electric-field calculation and the Biot-Savart (BS) formulation for magnetic-field prediction within a GNU Octave environment. The proposed approach was validated against field measurements and benchmarked against Finite Element Method Magnetics (FEMM) using root mean square error (RMSE), mean absolute error (MAE), and mean absolute percentage error (MAPE). Validation results demonstrated good agreement with measurements, achieving MAPE values of 3.00% and 7.24% for electric-field and magnetic-field predictions, respectively, outperforming FEMM in both cases. Computational benchmarking revealed substantial efficiency improvements, with execution-time reductions of approximately 29-31 times for electric-field calculations and 83-86 times for magnetic-field calculations relative to FEMM. The validated framework was subsequently applied to evaluate three 500-kV double-circuit transmission-line configurations commonly used in Indonesia, namely the super-bundle, low-reactance, and double-delta arrangements. Although all configurations satisfied the exposure limits specified by SNI 04-6950-2003, WHO, and ICNIRP guidelines, significant differences were observed in their electromagnetic-field performance. The double-delta configuration consistently produced the lowest electric-field and magnetic-field levels, reducing peak field exposure by up to 61% and 72%, respectively, compared with the super-bundle arrangement. The proposed CSM-BS framework provides an accurate and computationally efficient tool for transmission-line electromagnetic-field assessment, conductor arrangement assessment, and compliance verification.
Keywords—Biot-Savart Law; Charge Simulation Method; Double-Circuit Conductor Configuration; Electromagnetic Field Assessment; Extra-High-Voltage Transmission Lines
Extra-high-voltage (EHV) transmission lines constitute a critical component of the Indonesian power system, particularly the 500-kV Java-Bali interconnection network, which supports large-scale bulk power transfer across the country's most heavily populated regions [1]-[8]. The operation of these transmission lines generates power-frequency electric fields (EFs) and magnetic fields (MFs), which must be periodically evaluated to ensure compliance with public exposure regulations and electromagnetic compatibility requirements [9]-[13].
In Indonesia, public exposure to power-frequency electromagnetic fields is regulated by SNI 04-6950-2003, which specifies reference limits of 5 kV/m for electric-field (EF) intensity and 100 µT for magnetic flux density [11]. Additional requirements concerning transmission-line clearances and right-of-way (RoW) management are established in Permen ESDM No. 13/2021 [14]. Consequently, accurate and efficient prediction of EF and MF distributions is essential for transmission-line design, corridor planning, and regulatory compliance assessment [15].
Electromagnetic-field (EMF) assessment of transmission lines is commonly performed using finite-element-based tools such as COMSOL, ANSYS, and Finite Element Method Magnetics (FEMM). Although these methods can accurately model complex geometries and boundary conditions, they generally require domain discretization, mesh generation, and repeated numerical solution procedures, which may increase computational effort when multiple conductor configurations are investigated [16]- [20].
To overcome these limitations, analytical and semi-analytical approaches such as the Charge Simulation Method (CSM) and the Biot-Savart (BS) formulation have been employed for EF and magnetic-field (MF) calculations, respectively. These methods offer the advantage of avoiding air-domain discretization while maintaining satisfactory prediction accuracy. Nevertheless, their application to Indonesian 500-kV double-circuit transmission lines remains limited [21]-[24].
Furthermore, the EMF performance of the three dominant 500-kV double-circuit tower configurations used in Indonesia, namely the super-bundle (SB), low-reactance (LR), and double-delta (DD) arrangements, has not been comprehensively compared within a unified modelling framework. In addition, relatively few studies investigate both prediction accuracy and computational efficiency when evaluating alternative transmission-line configurations. Therefore, a validated and computationally efficient framework capable of supporting conductor-layout selection and EMF mitigation studies is still needed [5], [7], [25].
The main contributions of this study are as follows:
Accordingly, the objective of this study is to develop and validate a computationally efficient framework for power-frequency EMF assessment and to employ the validated framework to determine the optimal 500-kV double-circuit transmission-line configuration from an EMF mitigation perspective.
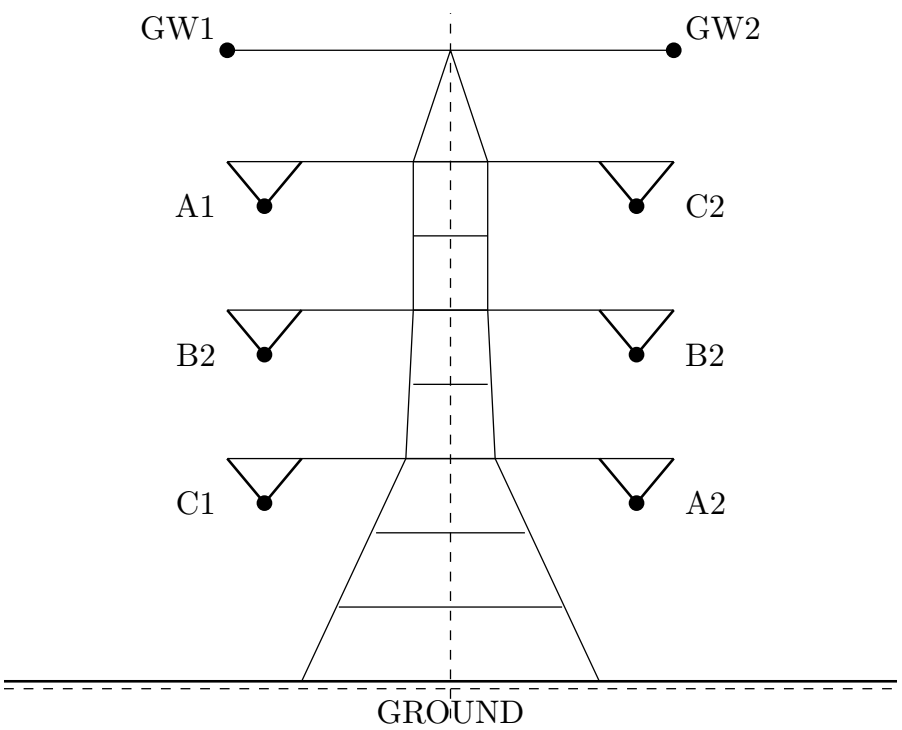
Three double-circuit conductor arrangements commonly employed in the Indonesian 500-kV transmission network were investigated, namely the SB, LR, and DD configurations [26], [27]. The conductor layouts are illustrated in Fig. 1 and the parameters in Table 1.
All configurations employ four-bundle Aluminium Conductor Steel Reinforced (ACSR) conductors with a sub-conductor diameter of 23.5 mm, bundle spacing of 0.2 m, conductor height of 19 m above ground level, and ground-wire diameter of 15.5 mm. EF and MF distributions were evaluated along a lateral corridor extending from −17 m to +17 m relative to the transmission-line centreline at an observation height of 1 m above ground level [14].
Parameter | Low-Reactance / Super-Bundle | Double-Delta |
A1-C2 Spacing (m) | 16 | 12 |
B1-B2 Spacing (m) | 16 | 18 |
C1-A2 Spacing (m) | 16 | 10 |
A1-B1 Spacing (m) | 7 | 5 |
B1-C1 Spacing (m) | 7 | 0 |
Ground wire height (m) | 37 | 29 |
Ground wire spacing (m) | 22 | 8 |
Note: All configurations employ four-bundle ACSR conductors with a sub-conductor diameter of 23.5 mm, bundle spacing of 0.2 m, phase conductor height of 19 m above ground, and ground-wire diameter of 15.5 mm.
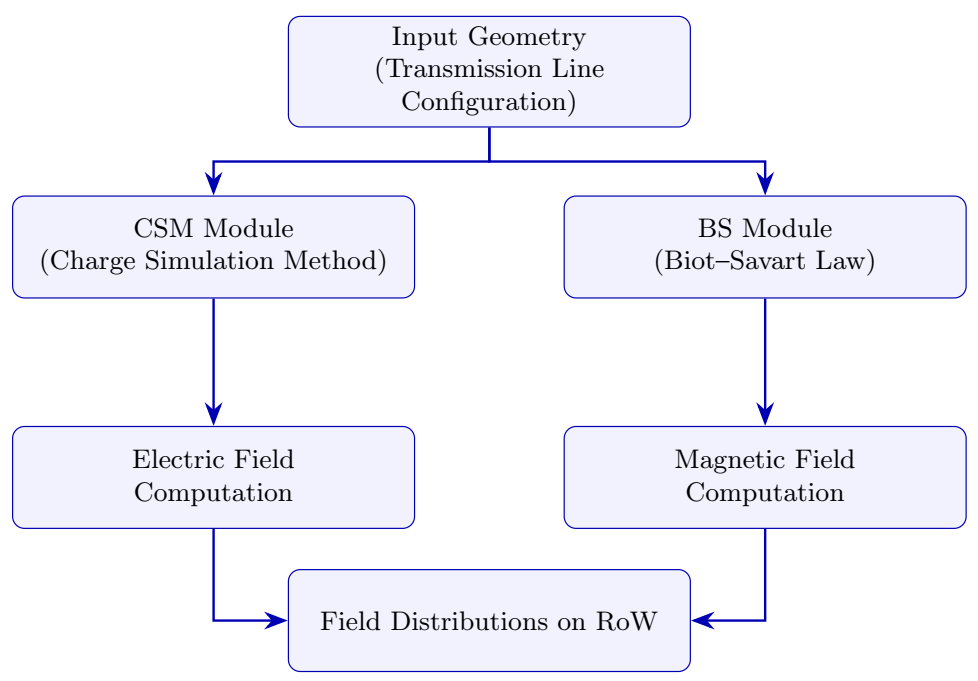
The EF distribution was calculated using the CSM implemented in GNU Octave [28]. The left side of Fig. 2 illustrates the computational workflow of the proposed CSM-BS framework for EF assessment. In this approach, conductor surface charges are represented by fictitious line charges located inside the conductors. The unknown charge magnitudes are obtained by satisfying conductor boundary conditions through the Maxwell potential coefficient matrix,
| (1) |
where V is the conductor potential vector, Q is the fictitious charge vector, and M is the Maxwell potential coefficient matrix [29].
For bundled conductors, the equivalent conductor radius was evaluated as
| (2) |
where  is the number of sub-conductors,
  is the sub-conductor radius, and
  is the bundle radius.
The ground plane was represented using the method of images. Once the charge distribution was determined, the EF components were calculated through superposition, and the total EF intensity was obtained as
| (3) |
All simulations were performed at a nominal system frequency of 50 Hz and a line-to-line voltage of 500 kV.
MF distributions were computed using the Biot-Savart formulation. The right side of Fig. 2 presents the computational workflow of the proposed CSM-BS framework for MF assessment. Assuming a homogeneous medium with relative permeability µr = 1, the magnetic flux density generated by an infinitely long conductor carrying current I is given by,
| (4) |
where μ0 denotes the permeability of free space and ρ is the radial distance between the conductor and the observation point.
The total magnetic-flux density was obtained through vector superposition of the contributions from all phase conductors. Balanced three-phase currents were assumed throughout the analysis.
To provide a reference solution for validation, EMF simulations were also performed using FEMM 4.2 [30]. A two-dimensional planar model with a 60 m × 60 m air domain and a depth of 1 m was adopted. A locally refined mesh with a minimum element size of 0.01 m was applied near the conductors, resulting in 47,641 nodes and 86,196 triangular elements. Electric-Field and MF values were extracted along the same observation path used in the CSM-BS simulations.
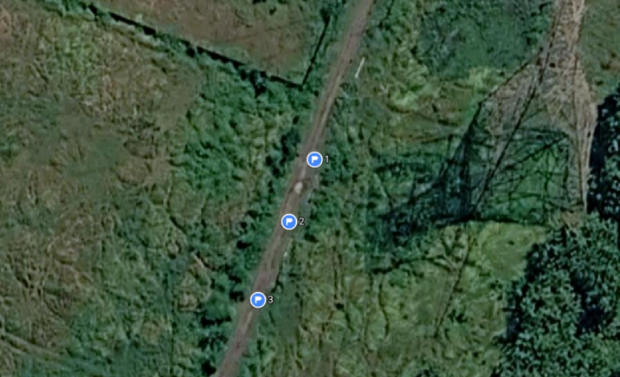
Electric-field measurements were conducted beneath an operational 500-kV transmission line located in Kaligawe, Pedan, Klaten, Indonesia. The measurement location is shown in Fig. 3.
Power-frequency EF intensity was measured using an ETS-Lindgren HI-3604 ELF Survey Meter installed at a height of 1 m above ground level [31], [32]. The measurement setup is shown in Fig. 4.
Measurements were conducted at three representative observation locations:
Ten measurements were recorded at each location and averaged to obtain the reference values used for validation.
Magnetic-field validation was performed using the measurement dataset reported in [33], obtained from a 150-kV double-circuit transmission line at Talang Kelapa 2, Indonesia. The transmission line operated at a load current of 270 A during the measurement campaign (see Table 2).
The conductor geometry and operating conditions reported in [33] were reproduced in both the Biot-Savart and FEMM models.
Parameter | Value |
System voltage (kV) | 150 |
Line current (A) | 270 |
Tower configuration | Double-circuit vertical |
A1-C2 Spacing (m) | 7.0 |
B1-B2 Spacing (m) | 7.0 |
C1-A2 Spacing (m) | 7.0 |
A1-B1 Spacing (m) | 4.0 |
B1-C1 Spacing (m) | 4.0 |
Lower phase height (m) | 17.5 |
Ground wire height (m) | 30.0 |
Ground wire spacing (m) | 4.0 |
The proposed CSM-BS framework was validated against measurement data. EF validation was performed using the Kaligawe 500-kV dataset, while MF validation utilized the Talang Kelapa 2 dataset. Prediction accuracy was evaluated using the Root Mean Square Error (RMSE), Mean Absolute Error (MAE), and Mean Absolute Percentage Error (MAPE):
| (5) |
| (6) |
| (7) |
where  and
and  denote the calculated and measured field values at the i-th observation point, respectively.
The computational performance of the CSM-BS framework and FEMM was evaluated under identical hardware and software conditions. For each transmission-line configuration, the total execution time required to generate EF and MF distributions was recorded.
The resulting execution times were compared to assess the suitability of both methods for repetitive simulations, conductor arrangement assessment, and transmission-line planning studies.
Following validation, the selected method was applied to evaluate the SB, LR, and double-delta transmission-line configurations.
The configurations were compared using the following performance indicators:
 )
) )
)The conductor arrangement producing the lowest overall EMF exposure was identified as the preferred configuration.
The predictive performance of the proposed CSM-BS framework was evaluated through comparison with measurement data and benchmarked against FEMM 4.2. In addition, computational performance was assessed through execution-time measurements. All simulations were performed on a 64-bit Windows 10 workstation equipped with an Intel® Core™ i7-6820HQ processor and 32 GB RAM.
Fig. 5 compares the electric-field (EF) distribution predicted by the CSM and FEMM models with the measured values obtained beneath the investigated 500-kV double-circuit transmission line.
Both models successfully reproduce the overall trend of the measured EF profile. However, the CSM results consistently exhibit closer agreement with the measurements throughout the observation corridor. The close correspondence between the measured and calculated profiles indicates that the adopted conductor geometry and boundary-condition representation adequately capture the actual electric-field behavior of the transmission line.
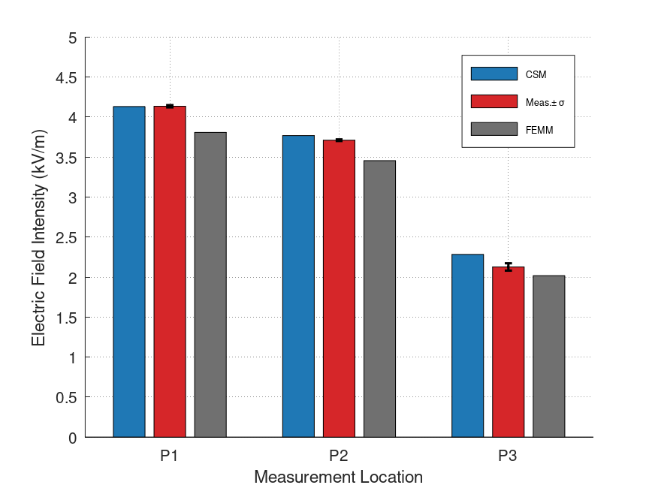
A point-by-point comparison of the EF values at the three observation locations is presented in Fig. 6.
As shown in Fig. 6, the CSM predictions remain consistently closer to the measured values than those obtained using FEMM, particularly at the outer observation points. This observation demonstrates the capability of the CSM formulation to accurately represent the ground-level electric-field distribution while avoiding the discretization requirements associated with finite-element models.
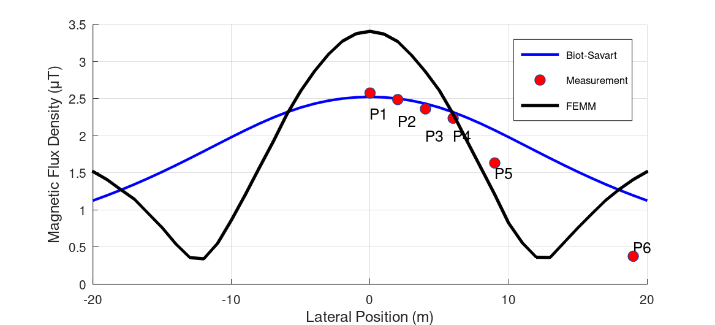
For magnetic-field validation, Fig. 7 compares the measured magnetic-field (MF) distribution with the predictions obtained using the Biot-Savart (BS) and FEMM approaches based on the Talang Kelapa 2 measurement dataset.
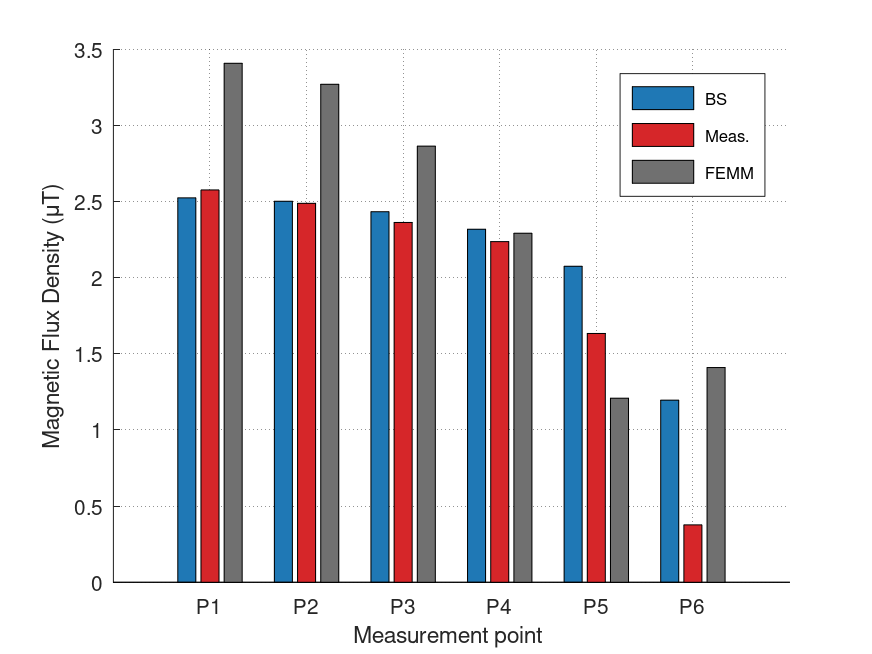
Both approaches reproduce the general characteristics of the measured MF profile. Nevertheless, the BS formulation provides closer agreement with the experimental data across most observation locations. The largest discrepancy occurred at a lateral distance of approximately 19 m from the transmission-line centreline, where the measured magnetic flux density was 0.43 µT, compared with 1.28 µT and 1.42 µT predicted by the BS and FEMM models, respectively. This deviation is likely associated with differences between the actual conductor geometry and the simplified simulation model, particularly with respect to conductor sag and conductor-to-ground clearance. Despite this localized discrepancy, the overall profile predicted by the BS formulation follows the measured distribution more closely than FEMM. Fig. 8 presents a detailed comparison of the MF values at the six observation locations.
The Biot-Savart model exhibits better agreement with the measured magnetic-field profile, particularly within the central region of the RoW. Although localized deviations remain at the outer measurement points, the overall agreement confirms the suitability of the BS formulation for power-frequency magnetic-field assessment.
The quantitative validation results are summarized in Table 3.
Metric | Electric Field (kV/m) | Magnetic Field (μT) | ||
CSM | FEMM | BS | FEMM | |
MAE | 0.0725 | 0.2304 | 0.1317 | 0.5187 |
RMSE | 0.0963 | 0.2476 | 0.2045 | 0.5893 |
MAPE (%) | 3.00 | 6.64 | 7.24 | 22.68 |
Table 3 confirms the superior predictive capability of the proposed CSM-BS framework. For EF prediction, the CSM model achieved MAE, RMSE, and MAPE values of 0.0725 kV/m, 0.0963 kV/m, and 3.00%, respectively, corresponding to reductions of approximately 69%, 61%, and 55% relative to FEMM. Similarly, for MF prediction, the Biot-Savart model achieved MAE, RMSE, and MAPE values of 0.1317 µT, 0.2045 µT, and 7.24%, respectively, outperforming FEMM by margins of approximately 75%, 65%, and 68%.
The MF validation metrics were calculated excluding the outermost observation point (P6). At this location, the measured MF magnitude was very small, making percentage-based error metrics highly sensitive to minor absolute deviations. When P6 was included, the MAPE increased from 7.24% to 42.23% for the Biot-Savart model and from 22.68% to 64.56% for FEMM, despite relatively small changes in the absolute error magnitude. Therefore, excluding P6 provides a more representative assessment of model performance within the principal exposure region of the transmission-line corridor.
Overall, the validation results demonstrate that the proposed CSM-BS framework provides more accurate electric-field and magnetic-field predictions than FEMM while requiring significantly lower computational complexity. Consequently, the validated CSM-BS framework was selected for the subsequent assessment of alternative transmission-line configurations.
The computational performance of the proposed CSM-BS framework and FEMM was evaluated for the three investigated transmission-line configurations. The average execution times required to compute the electric-field (EF) and magnetic-field (MF) distributions are summarized in Table 4.
Method | EF Time (s) | MF Time (s) |
CSM-BS (Super-Bundle) | 0.0892 | 0.0595 |
CSM-BS (Low-Reactance) | 0.0913 | 0.0608 |
CSM-BS (Double-Delta) | 0.0932 | 0.0621 |
CSM-BS (Average) | 0.0912 | 0.0608 |
FEMM (Average) | 2.7550 | 5.1168 |
As shown in Table 4, the proposed CSM-BS framework completed EF calculations in approximately 0.09 s and MF calculations in approximately 0.06 s for all investigated configurations. In comparison, FEMM required average computation times of 2.76 s and 5.12 s for EF and MF simulations, respectively. These results indicate a substantial reduction in computational effort when using the proposed mesh-free approach.
The computational speedup achieved by the CSM-BS framework relative to FEMM is presented in Table 5.
Configuration | EF Speedup (times) | MF Speedup (times) |
Super-Bundle | 31.1 | 85.9 |
Low-Reactance | 30.3 | 82.7 |
Double-Delta | 29.2 | 83.8 |
For EF simulations, the proposed framework achieved speedup factors ranging from 29.2 times to 31.1 times relative to FEMM. An even greater improvement was observed for MF calculations, where the computational speedup ranged from 82.7 times to 85.9 times. The larger acceleration observed in the MF analysis is primarily attributable to the direct implementation of the Biot-Savart formulation, which evaluates magnetic flux density through analytical vector superposition and therefore avoids the domain discretization and numerical solution procedures required by finite-element methods.
The significant reduction in execution time can be attributed to the mesh-free nature of the proposed framework. Unlike FEMM, which requires geometry discretization, mesh generation, matrix assembly, and numerical solution of the governing field equations, the CSM-BS framework directly computes EF and MF distributions from conductor geometries and operating conditions. Consequently, computational complexity is substantially reduced while maintaining good agreement with measurement data.
Only minor variations in execution time were observed among the super-bundle, low-reactance, and double-delta configurations, indicating that the computational cost of the proposed framework is largely insensitive to conductor arrangement. This characteristic is particularly advantageous for transmission-line planning studies involving repeated simulations, sensitivity analyses, and conductor arrangement assessment.
When considered together with the validation results presented in Table 3, the CSM-BS framework provides both higher prediction accuracy and significantly lower computational cost than FEMM. Therefore, the proposed framework was selected for the subsequent comparative assessment of the super-bundle, low-reactance, and double-delta transmission-line configurations.
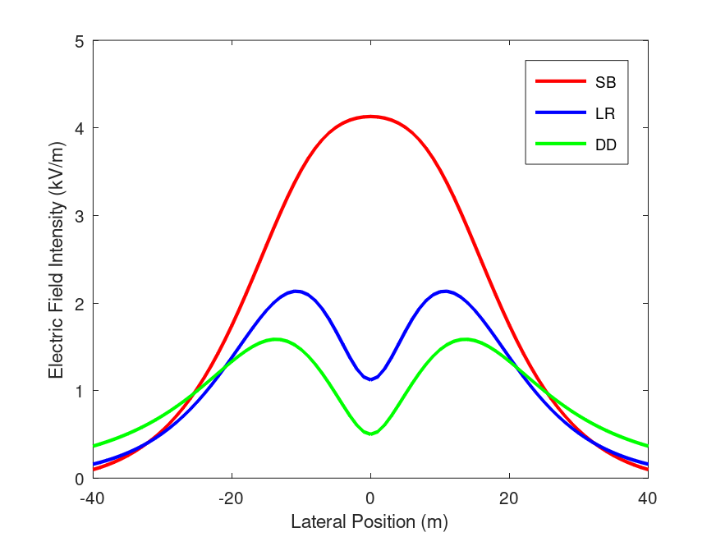
Fig. 9 presents the ground-level EF distributions calculated for the super-bundle, low-reactance, and double-delta transmission-line configurations.
The results indicate that conductor arrangement has a significant influence on both the magnitude and spatial distribution of the electric field within the transmission corridor. Although all three configurations exhibit symmetrical profiles about the transmission-line centreline, noticeable differences are observed in the peak electric-field intensity and the resulting field distribution patterns.
Among the investigated configurations, the super-bundle (SB) arrangement produces the highest electric-field levels throughout the corridor, with a peak value exceeding 4 kV/m at the transmission-line centreline. The broad central peak suggests relatively weak electric-field cancellation between the two circuits, resulting in the highest ground-level exposure. The electric-field intensity decreases gradually with increasing lateral distance and approaches low values beyond the corridor boundaries.
The low-reactance (LR) configuration exhibits a distinct double-peak distribution, with local maxima of approximately 2.1 kV/m located on either side of the centreline. A pronounced reduction in field intensity occurs directly beneath the transmission line, indicating enhanced cancellation of electric-field components due to the conductor arrangement and phase sequence. Relative to the super-bundle configuration, the low-reactance
arrangement reduces the peak electric-field intensity by approximately 49%.
The double-delta (DD) configuration provides the most effective electric-field mitigation. The peak electric-field intensity is limited to approximately 1.6 kV/m, corresponding to a reduction of approximately 61% compared with the super-bundle arrangement and 24% compared with the low-reactance configuration. In addition, the electric-field profile is smoother and more uniformly distributed across the corridor, indicating a more balanced charge distribution and stronger field-cancellation effects.
The electric-field levels at the right-of-way (RoW) boundaries (±17 m) were also evaluated to assess potential public exposure in areas adjacent to the transmission corridor. At the corridor boundary, the super-bundle configuration produced an electric-field intensity of approximately 2.4 kV/m, while the low-reactance and double-delta configurations generated approximately 1.7 kV/m and 1.2 kV/m, respectively. Consequently, the double-delta arrangement reduced the boundary electric-field level by approximately 38% relative to the super-bundle configuration. This finding indicates that the electric-field mitigation achieved by the double-delta geometry is maintained not only beneath the conductors but also throughout the accessible right-of-way region.
Overall, the results demonstrate that conductor geometry and phase arrangement play a critical role in electric-field mitigation for double-circuit EHV transmission lines. The effectiveness of the investigated configurations follows the order, Double-Delta > Low-Reactance > Super-Bundle, in terms of electric-field reduction. The superior performance of the double-delta configuration can be attributed to its balanced conductor arrangement, which enhances electric-field cancellation and minimizes ground-level exposure across the entire transmission corridor.
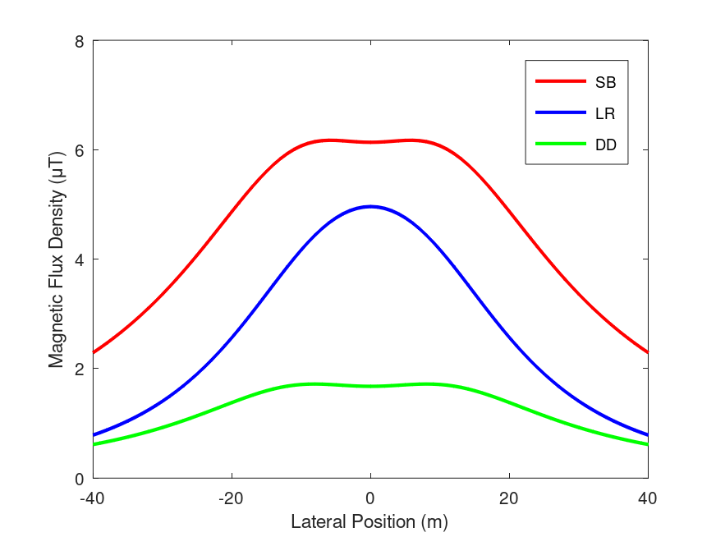
Fig. 10 presents the ground-level magnetic-field (MF) distributions calculated using the validated Biot-Savart formulation for the super-bundle, low-reactance, and double-delta transmission-line configurations.
The results demonstrate that conductor arrangement exerts a substantial influence on both the magnitude and spatial distribution of the magnetic field within the transmission corridor. Although all investigated configurations exhibit symmetrical profiles with respect to the transmission-line centreline, significant differences are observed in the resulting magnetic-flux-density levels and the effectiveness of magnetic-field cancellation.
The super-bundle (SB) configuration produced the highest magnetic-field exposure, with a peak magnetic flux density of approximately 6.1 µT occurring near the transmission-line centreline. The broad central peak indicates relatively weak cancellation between the magnetic fields generated by the two circuits, resulting in the highest ground-level MF levels among the investigated configurations.
The low-reactance (LR) arrangement reduced the peak magnetic flux density to approximately 5.0 µT, corresponding to an 18% reduction relative to the super-bundle configuration. This improvement can be attributed to enhanced phase-current cancellation resulting from the modified conductor arrangement. However, the magnetic-field intensity remains appreciably higher than that obtained for the double-delta configuration.
The double-delta (DD) configuration exhibited the lowest magnetic-field levels throughout the entire corridor. The peak magnetic flux density remained below 2.0 µT, representing reductions of approximately 66% and 64% relative to the super-bundle and low-reactance arrangements, respectively. The superior performance of the double-delta configuration indicates more effective cancellation of magnetic-field components arising from its balanced conductor geometry and phase-current distribution.
To evaluate potential public exposure near accessible areas adjacent to the transmission corridor, the magnetic-field levels at the right-of-way (RoW) boundaries (±17 m) were also analyzed. At the corridor boundary, the super-bundle configuration produced a magnetic flux density of approximately 5.3 µT, whereas the low-reactance and double-delta configurations yielded approximately 3.7 µT and 1.5 µT, respectively. Consequently, the double-delta arrangement reduced the boundary magnetic-field level by approximately 72% relative to the super-bundle configuration. This finding confirms that the magnetic-field mitigation achieved by the double-delta layout extends beyond the region directly beneath the conductors and remains effective throughout the entire right-of-way corridor.
Overall, the results demonstrate that conductor geometry and phase arrangement are critical factors governing magnetic-field mitigation in double-circuit EHV transmission lines. The effectiveness of the investigated configurations in reducing magnetic-field exposure follows the order: Double-Delta > Low-Reactance > Super-Bundle. The double-delta configuration consistently produced the lowest peak and boundary magnetic-field levels, thereby providing the largest safety margin relative to public exposure limits. This observation is consistent with the electric-field assessment, where the double-delta arrangement also exhibited the most favorable electromagnetic-field performance. Consequently, the double-delta configuration represents the most effective conductor arrangement for simultaneously reducing both electric-field and magnetic-field exposure within the transmission corridor.
A principal objective of the proposed CSM-BS framework is to evaluate whether the predicted electric-field (EF) and magnetic-field (MF) levels satisfy applicable public exposure requirements. Accordingly, the maximum field values obtained for each conductor configuration were assessed against the exposure limits specified by SNI 04-6950-2003, as well as the international guidelines issued by the World Health Organization (WHO) and the International Commission on Non-Ionizing Radiation Protection (ICNIRP).
For power-frequency exposure, SNI 04-6950-2003 prescribes reference limits of 5 kV/m for electric-field intensity and 100 µT for magnetic flux density. Similarly, WHO and ICNIRP recommend public exposure limits of 5 kV/m and 200 µT for electric and magnetic fields, respectively. The compliance assessment results are summarized in Table 6.
Configuration | Max EF (kV/m) | EF Utilization of Limit (%) | Max MF (µT) | MF Utilization of SNI Limit (%) |
Super-Bundle | 4.1 | 82.0 | 6.1 | 6.1 |
Low-Reactance | 2.1 | 42.0 | 5.0 | 5.0 |
Double-Delta | 1.6 | 32.0 | 1.7 | 1.7 |
The results indicate that all investigated configurations remain within the prescribed exposure limits. The super-bundle (SB) arrangement produced the highest electric-field intensity, reaching approximately 4.1 kV/m, corresponding to 82% of the allowable public exposure level. Although this value remains compliant with the applicable standards, it provides the smallest safety margin among the investigated configurations. In contrast, the low-reactance (LR) and double-delta (DD) arrangements reduced the peak electric-field intensity to approximately 2.1 kV/m and 1.6 kV/m, corresponding to only 42% and 32% of the prescribed limit, respectively.
A similar trend was observed for magnetic-field exposure. The highest magnetic flux density was again obtained for the super-bundle configuration, with a peak value of approximately 6.1 µT. This value corresponds to only 6.1% of the SNI limit and approximately 3.1% of the more permissive ICNIRP guideline. The low-reactance and double-delta configurations further reduced the maximum magnetic flux density to approximately 5.0 µT and 1.7 µT, respectively.
These findings demonstrate that all investigated conductor arrangements provide substantial compliance margins relative to both national and international exposure standards. Nevertheless, clear differences exist in their electromagnetic-field performance. While the super-bundle configuration remains fully compliant, the low-reactance and double-delta arrangements achieve significantly lower electric-field and magnetic-field levels, thereby offering greater margins of safety. Among the investigated alternatives, the double-delta configuration exhibits the lowest peak EF and MF levels and therefore provides the greatest overall compliance margin.
From an engineering perspective, the results indicate that regulatory compliance alone is insufficient for distinguishing between alternative transmission-line layouts, as all three configurations satisfy the prescribed exposure limits. Instead, conductor arrangement should be considered an optimization parameter aimed at minimizing public exposure while maintaining operational and structural requirements. Consequently, the double-delta arrangement represents the most favorable configuration from both a compliance and electromagnetic-field mitigation perspective.
The preceding analyses demonstrated that all investigated 500-kV transmission-line configurations comply with the exposure limits specified by SNI 04-6950-2003, WHO, and ICNIRP guidelines. In addition, the validation results confirmed the reliability of the proposed CSM-BS framework, which achieved MAPE values of 3.00% and 7.24% for electric-field (EF) and magnetic-field (MF) predictions, respectively. Therefore, the framework was considered sufficiently accurate for comparative evaluation of conductor arrangements. The electromagnetic performance of the investigated configurations is summarized in Table 7.
Configuration | Peak EF (kV/m) | Peak MF (µT) | EF at RoW (kV/m) | MF at RoW (µT) | Overall Ranking |
Super-Bundle | 4.1 | 6.1 | 2.4 | 5.3 | 3 |
Low-Reactance | 2.1 | 5.0 | 1.7 | 3.7 | 2 |
Double-Delta | 1.6 | 1.7 | 1.2 | 1.5 | 1 |
Table 7 indicates that the double-delta (DD) configuration consistently provides the lowest electromagnetic-field exposure among the investigated conductor arrangements. The DD configuration yielded the lowest peak EF and MF values as well as the lowest field levels at the right-of-way (RoW) boundaries. In contrast, the super-bundle configuration produced the highest ground-level field intensities throughout the transmission corridor, while the low-reactance configuration exhibited intermediate performance.
Relative to the super-bundle arrangement, the double-delta configuration reduced the peak EF intensity from 4.1 kV/m to 1.6 kV/m, corresponding to an improvement of approximately 61%. Similarly, the peak MF level decreased from 6.1 µT to 1.7 µT, representing a reduction of approximately 72%. Comparable improvements were observed at the RoW boundaries, where the double-delta configuration reduced EF and MF levels by approximately 38% and 72%, respectively.
The superior performance of the double-delta arrangement can be attributed to its balanced conductor geometry and phase arrangement, which promote stronger cancellation of both electric-field and magnetic-field components generated by adjacent phase conductors. As a result, lower field levels are maintained not only beneath the transmission line but also across the entire transmission corridor.
From a design perspective, the results demonstrate that conductor arrangement plays a decisive role in electromagnetic-field mitigation, even when all configurations satisfy applicable regulatory limits. Although the super-bundle, low-reactance, and double-delta arrangements all comply with national and international exposure standards, the double-delta configuration provides the largest compliance margin and the lowest overall public exposure.
Consequently, the double-delta configuration is identified as the preferred conductor arrangement for the investigated Indonesian 500-kV transmission-line system. Combined with the accuracy and computational efficiency of the proposed CSM-BS framework, this finding demonstrates the potential of the developed methodology as a practical engineering tool for transmission-line planning, right-of-way assessment, configuration evaluation, and compliance verification in accordance with SNI 04-6950-2003 and Permen ESDM No. 13/2021.
This study developed and validated a GNU Octave-based mesh-free computational framework that integrates the Charge Simulation Method (CSM) and the Biot-Savart (BS) formulation for electric-field (EF) and magnetic-field (MF) assessment of extra-high-voltage transmission lines. Validation against field measurements demonstrated good predictive capability, with MAPE values of 3.00% and 7.24% for EF and MF calculations, respectively, outperforming the corresponding FEMM predictions. These results confirm the suitability of the proposed framework for power-frequency electromagnetic-field assessment of transmission-line corridors.
Computational benchmarking revealed a significant efficiency advantage over FEMM, with execution-time reductions of approximately 29-31 times for EF simulations and 83-86 times for MF simulations. The mesh-free formulation therefore provides a practical alternative for repetitive simulations, sensitivity analyses, and comparative configuration studies.
Application of the validated framework to three representative Indonesian 500-kV double-circuit transmission-line configurations demonstrated that conductor arrangement has a substantial influence on electromagnetic-field exposure. Although all investigated configurations complied with SNI 04-6950-2003, WHO, and ICNIRP exposure limits, the double-delta configuration consistently produced the lowest EF and MF levels across the transmission corridor and at the right-of-way boundaries. Relative to the super-bundle arrangement, the double-delta configuration reduced peak EF and MF levels by approximately 61% and 72%, respectively.
Overall, the results demonstrate that the proposed CSM-BS framework provides an accurate and computationally efficient tool for transmission-line electromagnetic-field assessment, right-of-way studies, and compliance verification. The findings further indicate that the double-delta configuration represents the most favorable conductor arrangement for minimizing public electromagnetic-field exposure in the investigated 500-kV transmission-line system.
Future work will focus on incorporating conductor sag effects, unbalanced operating conditions, dynamic loading scenarios, and additional field measurements from multiple transmission-line configurations to further improve model fidelity and broaden the applicability of the proposed framework.
This work was supported by the Research Group Capacity Strengthening Program (PKGR-UNS), Universitas Sebelas Maret, Surakarta, under Contract No. 462/UN27.22/PT.01.03/2026. The authors gratefully acknowledge this support.
The authors further acknowledge the High Voltage Engineering Laboratory, Universitas Gadjah Mada, Yogyakarta, for providing access to the ETS-Lindgren HI-3604 ELF Survey Meter utilized during the field measurement campaign.
Warindi Warindi, Electromagnetic Field Assessment of Indonesian 500-kV Double-Circuit Transmission Lines Using Charge Simulation and Biot-Savart Methods: Validation, Benchmarking, and Configuration Evaluation