Journal of Fuzzy Systems and Control, Vol. 4, No 2, 2026 |
A Heuristic Evolutionary Multi-Objective Method for Indoor LED Lighting Optimization with DIALux and Experimental Validation
Faizal Abdul Rouf Asyahari 1 , Warindi 2,* , Inayati 3
1,2 Department of Electrical Engineering, Faculty of Engineering, Universitas Sebelas Maret, Surakarta, Indonesia
3 Department of Chemical Engineering, Faculty of Engineering, Universitas Sebelas Maret, Surakarta, Indonesia
Email: 1 faizal.asyahari@student.uns.ac.id, 2 warindi@staff.uns.ac.id, 3 inayati@staff.uns.ac.id
*Corresponding Author
Abstract—Indoor lighting optimization is commonly addressed using population-based metaheuristic algorithms such as the genetic algorithm and multi-objective particle swarm optimization. However, these methods generally rely on crossover, mutation, or swarm-update operators, resulting in relatively high computational complexity while placing greater emphasis on algorithmic optimization than on practical implementation and experimental validation. This study proposes a heuristic evolutionary multi-objective method for indoor LED lighting optimization that integrates constraint-aware candidate generation, lexicographical multi-objective ranking, and photometric evaluation to determine energy-efficient lighting layouts. Unlike conventional evolutionary algorithms, the proposed method directly generates feasible candidate solutions without employing crossover or mutation operators, thereby reducing computational complexity while maintaining solution quality for structured indoor lighting layouts. The optimized lighting configurations were validated through numerical photometric calculations based on SNI 6197:2020, DIALux simulations using a Lambertian photometric model, and direct luxmeter measurements. Experimental validation confirmed that the optimized lighting layouts satisfied the required illuminance and uniformity criteria, with average illuminance deviations ranging from 6% to 17% between computational predictions and practical measurements. The optimized lighting layouts also achieved Lighting Power Density (LPD) values ranging from 4.89 to 5.50 W/m², which are below the maximum allowable limit specified by SNI 6197:2020, demonstrating that the proposed optimization framework effectively reduces energy consumption while maintaining the required lighting performance. The proposed method provides a practical alternative to conventional evolutionary optimization methods by integrating efficient multi-objective optimization with comprehensive simulation and experimental validation, enabling reliable, energy-efficient, and standards-compliant indoor LED lighting design.
Keywords—Indoor LED Lighting; Multi-Objective Evolutionary Algorithm; Constraint-Aware Heuristic Method; DIALux; Experimental Validation
Indoor lighting plays a fundamental role in determining visual comfort, occupational safety, energy efficiency, and human productivity in residential, commercial, educational, and industrial buildings [1]-[4]. Although light-emitting diode (LED) technology has become the preferred lighting solution because of its high luminous efficacy, long service life, and reduced energy consumption, the overall performance of an indoor lighting system depends not only on the characteristics of the luminaires but also on their spatial distribution within the illuminated space [1], [2]. Improper luminaire placement may produce excessive power consumption, poor illuminance uniformity, and under-illuminated regions, resulting in visual discomfort and failure to satisfy lighting standards. Consequently, determining an appropriate lighting configuration has become an increasingly important optimization problem in modern building design. Indoor lighting design, therefore, requires not only sufficient illuminance but also an appropriate luminaire arrangement to achieve visual comfort while reducing unnecessary electrical energy consumption [4]-[6].
To address this problem, numerous optimization techniques have been proposed for indoor lighting design, including Genetic Algorithm (GA), Particle Swarm Optimization (PSO), Differential Evolution (DE), Non-sorting GA-II, Multi-objective Particle Swarm Optimization (MOPSO), and other evolutionary optimization methods [7]. These approaches generally formulate lighting design as a multi-objective optimization problem involving illuminance, energy consumption, luminaire quantity, or visual comfort. Several studies have successfully integrated optimization algorithms with photometric simulation tools such as DIALux to evaluate lighting performance under various design scenarios [8]-[10]. Recent developments have further explored artificial intelligence and surrogate models to accelerate the optimization process while maintaining prediction accuracy [11], [12]. Comparative studies have shown that different metaheuristic algorithms exhibit different convergence characteristics and computational costs, indicating that algorithm selection should consider both solution quality and computational efficiency rather than optimization accuracy alone [13]-[15].
Despite these advances, several important limitations remain. First, most existing studies primarily focus on improving the optimization algorithm itself, whereas comparatively less attention has been devoted to developing an integrated optimization method specifically tailored to practical indoor lighting design [16], [17]. Second, many optimization methods employ population-based search mechanisms involving crossover, mutation, Pareto sorting, or swarm-update operators, which may increase computational complexity when evaluating large numbers of lighting configurations under multiple design constraints [13]-[18]. Third, previous studies frequently emphasize average illuminance or energy consumption while treating minimum illuminance, illuminance uniformity, and practical installation constraints as secondary evaluation criteria [16]-[19]. Finally, the majority of published studies validate their results only through numerical simulations, whereas comprehensive validation combining photometric calculations, professional lighting simulation, and direct experimental measurements remains relatively limited [10], [20].
To address these limitations, this study proposes a heuristic evolutionary multi-objective method for indoor LED lighting optimization. Unlike conventional evolutionary algorithms such as GA, NSGA-II, and MOPSO, the proposed method does not rely on crossover, mutation, Pareto-front evolution, or swarm-update operators. Instead, it integrates constraint-aware candidate generation, lexicographical multi-objective ranking, and Lambertian photometric evaluation to efficiently identify feasible lighting configurations satisfying illuminance requirements while minimizing Lighting Power Density (LPD) and the number of installed luminaires. The method is specifically designed for structured indoor lighting layouts in which practical installation constraints, including wall clearance, luminaire spacing, and photometric feasibility, play a dominant role in determining solution quality.
The proposed method is further validated through an integrated three-stage verification procedure consisting of analytical photometric calculations based on SNI 6197:2020, DIALux simulations employing a Lambertian photometric model, and direct luxmeter measurements conducted under controlled experimental conditions. The novelty of this study lies in the development of a constraint-aware heuristic evolutionary multi-objective lighting optimization framework that integrates photometric modeling, constraint handling, lexicographical multi-objective ranking, numerical verification, DIALux simulation, and experimental validation into a unified workflow, rather than proposing a new evolutionary algorithm. The primary scientific contribution is the establishment of a practical and experimentally validated optimization framework capable of simultaneously satisfying illuminance requirements, improving illuminance quality and uniformity, reducing LPD, and minimizing the number of installed luminaires. Consequently, the proposed framework provides reliable lighting layout recommendations that satisfy Indonesian National Standards while demonstrating practical applicability for indoor LED lighting design.
The overall research method adopted in this study is illustrated in Fig. 1. The proposed method consists of five main stages: (i) acquisition of room and luminaire parameters, (ii) multi-objective lighting optimization, (iii) photometric evaluation through DIALux simulation, (iv) direct illuminance measurement using a luxmeter, and (v) error analysis between simulation and experimental results. The optimization process aims to determine the most suitable luminaire configuration by simultaneously considering average illuminance ( ), minimum illuminance (
 ), illuminance uniformity, and LPD. The optimized lighting layouts are subsequently imported into DIALux for photometric verification. Finally, direct measurements are conducted under actual installation conditions to validate the simulation results and evaluate the reliability of the proposed method. Similar optimization–simulation–validation workflows have been reported as effective
approaches for lighting system design and performance assessment [16], [17], [20].
The photometric performance of each candidate lighting configuration was evaluated using a point-by-point illuminance calculation model. Initially, the required number of luminaires was estimated using the lumen method based on the target illuminance level, room dimensions, luminaire luminous flux, utilization factor, and maintenance factor. This estimation was subsequently used to define the feasible search space during the optimization process [16]. The adopted photometric model follows the conventional point-by-point evaluation approach widely employed in practical lighting measurements and photometric analyses [21].
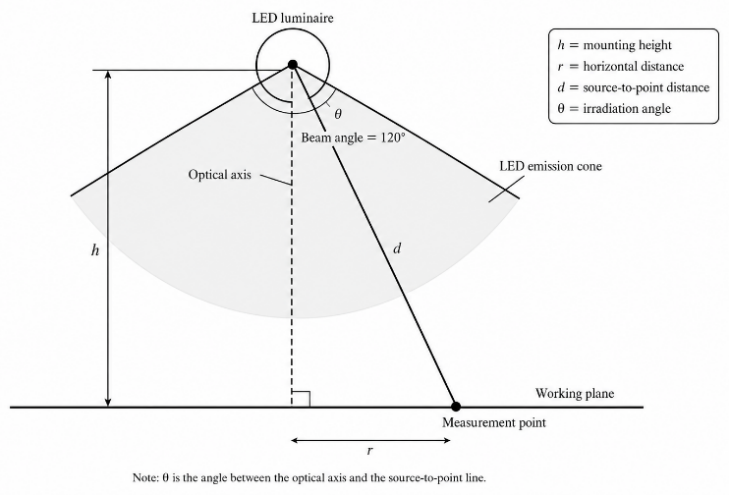
As illustrated in Fig. 2, each LED luminaire was modeled as a Lambertian emitter. The illuminance at each measurement point was calculated based on the mounting height ( ), horizontal distance (
 ), source-to-point distance (
 ), irradiation angle (
 ), and luminaire beam angle. Following the Lambertian radiation model and the inverse-square law, the illuminance contribution of each luminaire was evaluated over a Cartesian measurement grid covering the entire working plane [20].
Based on the geometric relationship illustrated in Fig. 2, the illuminance at each measurement point was calculated using the Lambertian point-source model [22]. By expressing the source-to-point distance as a function of the mounting height and irradiation angle, the illuminance equation can be written as
| (1) |
where E denotes illuminance ( ), I() is the luminous intensity in the direction of the measurement point (
 ), is the irradiation angle (˚), and h represents the luminaire mounting height above the working plane (
 ). This formulation combines the inverse-square law and angular attenuation of luminous intensity under the Lambertian assumption, enabling efficient point-by-point illuminance calculation across the evaluation grid.
The total illuminance distribution was obtained by summing the contributions from all luminaires. The resulting illuminance map was subsequently used to determine average illuminance (), minimum illuminance (), illuminance uniformity, and LPD, which served as the primary performance indicators in the proposed optimization method. These indicators were further employed for comparison with DIALux simulations and direct luxmeter measurements during the validation stage [20].
The overall optimization workflow adopted in this study is illustrated in Fig. 3. Each candidate solution consisted of a specific combination of luminaire type, number of luminaires, and luminaire positions within the room.
Fig. 3 illustrates the complete optimization procedure implemented in the proposed method. The optimization begins by initializing the room geometry, luminaire database, target illuminance, and installation constraints. Candidate lighting configurations are subsequently generated within the feasible search space and evaluated using the Lambertian photometric model. Each candidate is then examined against the predefined design constraints, including minimum illuminance, minimum spacing between luminaires, and minimum wall clearance. Candidate configurations violating these constraints receive penalty values, whereas feasible configurations are ranked using a lexicographical multi-objective strategy that prioritizes illuminance feasibility, illuminance quality, LPD, and luminaire quantity. The optimization iterates until the stopping criterion is satisfied, after which the highest-ranked feasible configuration is selected.
For every candidate configuration, the photometric model described in Section B was employed to calculate the resulting illuminance distribution over the working plane.
A multi-objective evaluation strategy was adopted to simultaneously consider lighting quality and energy efficiency. The optimization process aimed to maximize average illuminance (), minimum illuminance (), and illuminance uniformity, while minimizing LPD and the total number of installed luminaires. Candidate solutions that failed to satisfy the prescribed illuminance requirements were assigned penalty values, whereas feasible solutions were ranked according to their overall lighting performance and energy efficiency [16], [20].
To ensure practical applicability, several installation constraints were incorporated into the optimization process. These constraints included minimum spacing between luminaires, minimum distance from surrounding walls, allowable luminaire quantities, and room geometry limitations. Such constraints prevented the generation of unrealistic lighting layouts and ensured that the optimized solutions remained suitable for practical implementation [16], [23].
The optimization process iteratively generated and evaluated candidate lighting configurations within the feasible search space. The highest-ranked solutions were subsequently selected for photometric verification using DIALux simulation and experimental validation through direct luxmeter measurements. This workflow enabled systematic comparison between computational predictions, simulation results, and measured illuminance data under actual installation conditions.
The implementation procedure of the proposed method is summarized in Fig. 4. The pseudocode outlines the sequence of candidate generation, photometric evaluation, constraint handling, penalty assignment, multi-objective ranking, and best-solution updating performed during the optimization process.
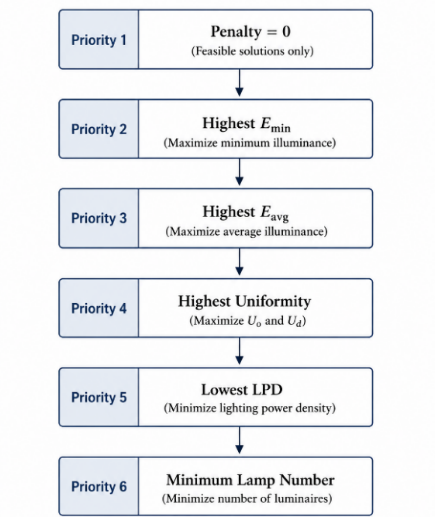
Unlike conventional evolutionary algorithms employing crossover, mutation, or swarm-update operators, the proposed method utilizes a heuristic candidate generation strategy combined with constraint-aware filtering and lexicographical multi-objective ranking. Similar heuristic search strategies have demonstrated competitive optimization performance while reducing computational complexity compared with conventional population-based evolutionary algorithms [13], [24]. Consequently, no weighted fitness function is employed. Instead, candidate configurations are first classified according to feasibility and subsequently ranked based on minimum illuminance, average illuminance, illuminance uniformity, LPD, and the number of installed luminaires. This strategy simplifies the optimization process while preserving solution quality for structured indoor lighting design problems.
The optimization simultaneously considers illuminance quality, LPD, and the number of luminaires, consistent with recent multi-objective lighting optimization studies [23]. The primary objective was to satisfy the target illuminance requirement while minimizing LPD and the number of installed luminaires. The lighting quality of each candidate configuration was evaluated using average illuminance (), minimum illuminance (), and illuminance uniformity [16], [17].
To ensure compliance with the prescribed lighting requirement, a target illuminance level of 100 lux was adopted throughout this study. Candidate solutions that did not satisfy the prescribed minimum illuminance requirement were penalized during the optimization process. The penalty function is defined as follows:
| (2) |
where  denotes the required minimum illuminance (100 lux), and is the minimum illuminance obtained from the candidate lighting configuration (lux). Candidate solutions satisfying the prescribed illuminance requirement receive zero penalty, whereas infeasible solutions are penalized in proportion to their deviation from the target illuminance. Consequently, feasible solutions are always prioritized over infeasible ones during the ranking process, even if the latter exhibit lower energy consumption or require fewer luminaires.
Illuminance uniformity was evaluated using the ratio between minimum illuminance and average illuminance as in:
| (3) |
where Uₒ denotes illuminance uniformity (-), is the minimum illuminance (lux), and is the average illuminance over the working plane (lux). Higher uniformity values indicate a more evenly distributed lighting
condition [10].
The energy performance of each candidate configuration was assessed using LPD, calculated as in:
| (4) |
where Pₜₒₜₐₗ represents the total installed electrical power (W) and A is the room area (m2). Lower LPD values indicate higher energy efficiency and reduced operational energy demand [16], [21].
During the optimization process, candidate solutions were ranked according to illuminance feasibility, uniformity, LPD, and the number of luminaires. This strategy identified lighting configurations that balance visual performance, energy efficiency, and practicality.
Since multiple performance indicators were considered simultaneously, the proposed method employed a lexicographical multi-objective ranking strategy instead of combining all objectives into a single weighted fitness function. As illustrated in Fig. 5, candidate configurations were prioritized according to a predefined hierarchy to ensure that lighting quality requirements were satisfied before energy-efficiency criteria were considered.
DIALux evo was employed as an independent lighting simulation platform to validate the illuminance predictions generated by the proposed optimization method. Two experimental scenarios were considered in this study, namely Room A (1.5 m × 1.5 m × 2 m) and Room B (2 m × 2 m × 2 m). These room dimensions were selected to represent compact indoor environments that could be reproduced under controlled experimental conditions.
As illustrated in Fig. 6, the optimized luminaire configurations generated by the proposed method were directly implemented in DIALux using identical room dimensions, mounting heights, luminaire specifications, and photometric parameters. Illuminance calculations were performed on Cartesian measurement grids corresponding to the experimental measurement locations to ensure consistency among optimization results, DIALux simulations, and luxmeter measurements.
The DIALux simulations served as an intermediate validation stage between the proposed photometric model and direct experimental measurements. This approach enabled independent verification of the illuminance distribution predicted by the optimization method before comparison with the measured lux values obtained from the physical test environments [20].
(a) | (b) |
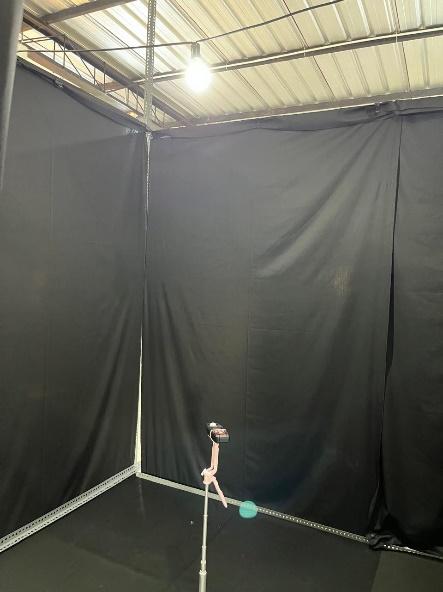
Fig. 7 presents the reconfigurable experimental test chamber employed for the validation measurements. The wall positions could be adjusted to reproduce Room A (1.5 m × 1.5 m × 2 m) and Room B (2 m × 2 m × 2 m) using the same structural method. Low-reflectance black curtains were applied to the surrounding wall surfaces to minimize interreflection effects and to maintain consistency with the boundary conditions adopted in the DIALux simulations. The same luminaire type, mounting position, and measurement grid configuration were used throughout the validation process.
The experimental measurement conditions adopted throughout the validation process are summarized in Table 1. The listed specifications include the measurement instrument, calibration procedure, environmental conditions, surface reflectance assumptions, and measurement uncertainty to ensure that the experimental results can be reliably compared with the computational predictions and DIALux simulations [25].
Parameter | Specification |
Measurement period | Nighttime (approximately 7 pm – 8 pm) |
Ambient lighting | External lighting switch off |
Luxmeter | TASI Model TA636A |
Measurement range | 0.1 – 200000 lux |
Accuracy | 4% |
Calibration | Zero adjustment before each measurement |
Wall reflectance | Low-reflectance black curtain (≈ 0.05) |
Ceiling reflectance | No reflectance |
Floor reflectance | Low-reflectance black tile |
Measurement uncertainty | ±4% of reading |
Prior to each experimental session, the luxmeter was inspected following the manufacturer's recommended zero-check procedure to minimize systematic measurement errors. All measurements were conducted with external lighting sources switched off to eliminate ambient light interference. Low-reflectance black curtains surrounded the experimental chamber to minimize interreflection effects and to reproduce the boundary conditions assumed during the DIALux simulations. The ceiling, floor, and luminaire mounting conditions remained unchanged throughout the experiments to ensure measurement consistency. Consequently, the measured illuminance values can be directly compared with the computational predictions generated by the proposed optimization method.
The illuminance measurements were performed using a digital luxmeter at predefined Cartesian grid points distributed across the measurement plane, as illustrated in Fig. 8. Grid-based illuminance mapping has also been widely adopted for evaluating spatial lighting distribution and validating lighting system performance under practical conditions [3]. The measurement locations corresponded to the evaluation grid adopted in both the optimization method and DIALux simulations, enabling direct comparison among computational predictions, simulation results, and experimental observations. This consistent measurement arrangement ensured that all validation methods were evaluated using identical spatial sampling locations.
For each room configuration, illuminance values were recorded at all grid locations and subsequently compared with the results obtained from the proposed optimization framework and DIALux simulations. This comparison enabled a quantitative assessment of the accuracy and reliability of the proposed photometric model while verifying its capability to predict practical illuminance distributions under controlled experimental conditions.
The accuracy of the proposed optimization method was evaluated by comparing the predicted illuminance values with both DIALux simulations and luxmeter measurements. The percentage error was calculated using (5), where the reference value corresponds to either the DIALux simulation result or the measured illuminance value obtained from the experimental setup.
| (5) |
The error analysis was performed for average illuminance (Eₐᵥg), minimum illuminance (Eₘᵢₙ), and illuminance uniformity. Lower error values indicate stronger agreement between the optimization method, simulation results, and experimental measurements.
The measurement uncertainty associated with the luxmeter was considered during the interpretation of the validation results. The reported percentage errors, therefore, represent the combined influence of photometric modeling assumptions, experimental uncertainty, luminaire manufacturing tolerances, and environmental variations between the simulation model and the physical measurements.
(a) | (b) |
This section presents the validation results of the proposed multi-objective lighting optimization method through numerical prediction, DIALux simulation, and direct experimental measurements. Two experimental scenarios were investigated, namely Room A (1.5 m × 1.5 m × 2 m) with a single luminaire and Room B (2 m × 2 m × 2 m) with two luminaires. The comparison focuses on the photometric performance indicators, including average illuminance (), minimum illuminance (), and maximum illuminance ( ), followed by an error analysis to evaluate the agreement between computational predictions and the actual measurements.
Room A was employed to evaluate the proposed method under a single-luminaire configuration. The optimized lighting layout generated by the proposed method was subsequently implemented in DIALux and validated through direct luxmeter measurements. Table 2 summarizes the comparison among the proposed method, DIALux simulation, and the experimental measurements.
Parameter | Proposed Method | DIALux | Measurement |
Luminaire | 11W/1210lm | 11W/1210lm | 11W/1210lm |
Number of luminaires | 1 | 1 | 1 |
Total installed power (W) | 11 | 11 | 11 |
LPD (W/m2) | 4.89 | 4.89 | 4.89 |
| 90.28 | 93.7 | 100.04 |
| 54.80 | 50 | 67 |
| 137.64 | 136 | 162 |
In addition to satisfying the illuminance requirements, the optimized configuration required only 11 W of installed electrical power, corresponding to an LPD of 4.89 W/m². This demonstrates that the proposed framework simultaneously achieves adequate lighting performance and energy-efficient operation.
The experimental measurements produced higher illuminance values than both the proposed method and the DIALux simulation. Nevertheless, all three approaches exhibited similar illuminance distribution patterns, indicating that the proposed photometric model successfully represented the overall lighting characteristics. From a practical lighting design perspective, the slightly higher measured illuminance is preferable to lower values because the required lighting level is fully satisfied under actual operating conditions. The remaining differences are attributed to practical factors such as luminaire photometric tolerances, measurement uncertainty, and residual interreflection effects that are difficult to represent completely in computational models.
Room B was used to investigate the performance of the proposed method under a two-luminaire configuration. Similar validation procedures were applied by comparing the optimization results with DIALux simulations and direct luxmeter measurements. Table 3 presents the corresponding photometric performance indicators.
For Room B, the optimized two-luminaire configuration resulted in a total installed power of 22 W, corresponding to an LPD of 5.50 W/m². Although the optimization framework also identified a feasible single-luminaire solution using a higher-power lamp, the two-luminaire configuration was intentionally selected to demonstrate the influence of multiple luminaires on the spatial illuminance distribution while maintaining a low LPD.
A similar tendency was observed for Room B, where the experimental measurements consistently exceeded the predicted illuminance values obtained from the proposed method and DIALux. Despite these differences, the optimized lighting configuration satisfied the intended lighting objective while maintaining the expected illuminance distribution. The results demonstrate that the proposed optimization method provides reliable guidance for practical luminaire layout design, whereas the higher measured illuminance offers an additional safety margin for achieving the required lighting performance in real indoor environments.
To facilitate a direct visual comparison with the DIALux simulations, the illuminance values measured at each Cartesian grid point were interpolated and presented as spatial contour maps using the same color scale adopted in the simulation results. The measured illuminance distributions for Room A and Room B are illustrated in Fig. 9.
Parameter | Proposed Method | DIALux | Measurement |
Luminaire | 11W/1210lm | 11W/1210lm | 11W/1210lm |
Number of luminaires | 2 | 2 | 2 |
Total installed power (W) | 22 | 22 | 22 |
LPD (W/m²) | 5.50 | 5.50 | 5.50 |
E avg | 123.83 | 121 | 145.99 |
E min | 72.67 | 66.2 | 103 |
E max | 171.61 | 165 | 207 |
Fig. 9 demonstrates that the measured illuminance distributions closely resemble the corresponding DIALux simulation results presented in Fig. 6. For Room A (Fig. 8(a)), the highest illuminance is concentrated near the center of the room and gradually decreases toward the boundaries, indicating a nearly symmetric distribution produced by the single luminaire configuration. For Room B (Fig. 8(b)), the presence of two luminaires generates a broader high-illuminance region with a relatively uniform distribution across the central area. Although the experimentally measured illuminance values are consistently higher than the simulated values, both rooms exhibit similar spatial distribution patterns, confirming that the proposed optimization method accurately predicts the overall illuminance characteristics.
To quantitatively evaluate the agreement between the computational predictions and the experimental measurements, the percentage error was calculated using (5), where the luxmeter measurements were considered as the reference values. The resulting errors for both Room A and Room B are summarized in Table 4. The observed agreement between simulation and experiment is also consistent with previous experimental lighting validation studies reported in the literature [10], [20].
Parameter | Room A Proposed Method (%) | Room A DIALux (%) | Room B Proposed Method (%) | Room B DIALux (%) |
E avg | 9.76 | 6.34 | 15.18 | 17.12 |
E min | 18.21 | 25.37 | 29.45 | 35.73 |
E max | 15.04 | 16.05 | 17.10 | 20.29 |
Table 4 summarizes the percentage errors between the computational predictions, DIALux simulations, and the experimental measurements. The proposed method and the DIALux simulations consistently underestimated the measured illuminance values by approximately 6–17% for the average illuminance. Despite these discrepancies, all lighting configurations satisfied the required illuminance criteria and exhibited similar illuminance distribution patterns, indicating good agreement between the computational predictions and the experimental observations.
In addition to the photometric validation, the optimized lighting configurations also demonstrated favorable energy performance. The proposed optimization framework achieved LPD values ranging from 4.89 to 5.50 W/m² for the evaluated room configurations. These values are consistently lower than the maximum allowable LPD of 6.35 W/m² specified by SNI 6197:2020 for residential bedrooms, indicating that the optimized lighting layouts not only satisfy the required illuminance criteria but also comply with the national energy conservation requirements. This result demonstrates that minimizing the number of installed luminaires through the proposed heuristic evolutionary multi-objective optimization framework simultaneously reduces electrical power demand while maintaining acceptable lighting quality, thereby improving the overall energy efficiency of the indoor lighting system.
The first source of discrepancy originates from residual light reflections inside the experimental chamber. Although low-reflectance black curtains were employed to minimize interreflection, the surrounding surfaces, floor, luminaire housing, and supporting structures still reflected a small portion of the emitted light toward the measurement plane. Consequently, the measured illuminance became slightly higher than the simulated values, which were calculated under simplified photometric assumptions.
A second contributor is the manufacturing tolerance of commercial LED luminaires. The nominal luminous flux specified by the manufacturer represents a typical value rather than the exact output of every individual lamp. Small variations in LED efficacy, driver performance, operating temperature, and spectral power distribution may increase the actual luminous flux perceived by the luxmeter, thereby producing higher illuminance than predicted by both the computational model and the DIALux simulation.
Additional discrepancies may also arise from practical installation and measurement conditions. Minor deviations in luminaire mounting position, measurement-point alignment, and luxmeter orientation may influence the measured illuminance, particularly in regions exhibiting steep illuminance gradients. Moreover, the luxmeter itself introduces measurement uncertainty because its accuracy is limited by the manufacturer's specified tolerance and spectral response. Since the spectral sensitivity of the sensor may not perfectly match the standard photopic response assumed in photometric calculations, small systematic differences between simulated and measured illuminance are expected. Collectively, these factors contribute to the observed discrepancies without affecting the overall agreement between the computational predictions and the experimental measurements.
Environmental conditions also contributed to the observed discrepancies between the computational predictions and the experimental measurements. Although the measurements were conducted at night with external lighting switched off and low-reflectance black curtains were installed to minimize interreflections, the experimental chamber could not completely eliminate residual reflections from the floor, luminaire housing, supporting structures, and surrounding surfaces. Consequently, the measured illuminance values remained systematically higher than the idealized computational predictions. These observations indicate that environmental conditions should be considered when interpreting practical lighting measurements, even under carefully controlled experimental settings.
From an engineering perspective, the observed overestimation is preferable to underestimation because all experimental measurements remained above the required illuminance threshold. Therefore, the optimized lighting configurations provide an additional operational safety margin while maintaining compliance with the target lighting standard. Overall, the close agreement between the computational predictions, DIALux simulations, and experimental measurements demonstrates that the proposed heuristic evolutionary multi-objective method provides reliable lighting layouts for practical indoor applications.
This study proposed a multi-objective lighting optimization method for determining indoor LED lighting layouts based on photometric performance and energy efficiency. The proposed method combines lumen-based initialization, Lambertian photometric modeling, and a constraint-aware optimization strategy to determine feasible luminaire configurations while considering average illuminance (), minimum illuminance (), illuminance uniformity, LPD, and the number of installed luminaires.
The proposed method was validated through independent DIALux simulations and direct luxmeter measurements using two experimental room configurations. The experimental results showed good agreement with the computational predictions, although the measured illuminance values were consistently higher than the simulated values. For the evaluated room configurations, the average illuminance predicted by the proposed method and DIALux differed from the experimental measurements by approximately 6–17%, while preserving the overall illuminance distribution. Such differences are considered acceptable because the required lighting levels remained satisfied under practical operating conditions.
More importantly, the proposed optimization framework successfully reduced the installed lighting capacity by selecting only the number of luminaires required to satisfy the prescribed illuminance criteria while maintaining low LPD. The optimized lighting layouts achieved LPD values ranging from 4.89 to 5.5 W/m², which are consistently below the maximum allowable LPD of 6.35 W/m² specified by SNI 6197:2020 for residential bedrooms. This indicates that the proposed optimization framework is capable of meeting the required lighting performance while simultaneously reducing electrical power demand. Consequently, the method improves energy efficiency without compromising illuminance quality, making it suitable for practical indoor LED lighting design where both visual comfort and energy conservation are equally important.
Future work may consider incorporating wall reflectance characteristics, measured photometric data of commercial luminaires, and larger indoor environments to further improve the prediction accuracy and applicability of the proposed optimization method.
The authors would like to express their sincere appreciation to the Energy Conversion and Electric Power Systems Laboratory, Department of Electrical Engineering, Faculty of Engineering, Universitas Sebelas Maret, Indonesia, for providing the experimental facilities and continuous support throughout this research. The authors also gratefully acknowledge Mr. Naufal Putra Pradana for his valuable technical assistance in the development of the computer program used in this study.
Faizal Abdul Rouf Asyahari, A Heuristic Evolutionary Multi-Objective Method for Indoor LED Lighting Optimization with DIALux and Experimental Validation