Journal of Fuzzy Systems and Control, Vol. 4, No 3, 2026 |
Optimization of Photovoltaic (PV) Hosting Capacity in 20 kV Distribution System Using Grey Wolf Optimizer (GWO) Algorithm
Syah Ridho Natiqoh 1, Atikah Surriani 2,*, Jimmy Trio Putra 3, Ahmad Adhiim Muthahhari 4
1, 2, 3, 4 Department of Electrical Engineering and Informatics, Universitas Gadjah Mada, Yogyakarta, Indonesia
Email: 1 syahridhonatiqoh@mail.ugm.ac.id, 2 atikah.surriani.sie13@ugm.ac.id, 3 jimmytrioputra@ugm.ac.id,
4 ahmad.adhiim.m@ugm.ac.id
*Corresponding Author
Abstract—The transition toward sustainable energy systems to mitigate global warming caused by greenhouse gas emissions from fossil fuel-based power generation has accelerated the integration of photovoltaic (PV) systems into distribution networks. However, massive and uncontrolled PV integration may lead to operational issues in power systems. Therefore, hosting capacity studies are required to determine the maximum PV capacity that can be integrated without violating technical operating constraints. Due to the complex, non-linear, and non-convex nature of the hosting capacity problem, effective optimization techniques are necessary. This study proposes the Grey Wolf Optimizer (GWO) algorithm to determine the optimal location and capacity of PV with the objectives of maximizing the PV penetration while minimizing system power losses. The Site Planning Model (SPM) method is employed to identify candidate buses for PV installation, thereby reducing space and computational time. By coupling GWO's global search with SPM-based candidate-bus pre-selection, this study reduces the optimization search space while preserving solution quality. The IEEE 33-bus 20 kV test system is used to evaluate the performance of the proposed method in single and multiple PV installations with inverter power factors of unity and 0.95 lagging. The results show that the GWO algorithm achieves stable and consistent convergence, with a maximum PV penetration rate of 87.99% and a system power loss reduction of 85.57% in the scenario involving three PV units on three busbars at a 0.95 lagging power factor. Furthermore, an inverter power factor closer to unity tends to reduce the maximum achievable PV penetration. The proposed approach also improves voltage profiles, reduces line loading, and enhances overall distribution system performance.
Keywords—Grey Wolf Optimizer (GWO); Hosting Capacity; Maximum Penetration; Minimum Power Losses; Photovoltaic (PV)
The issue of greenhouse gas (GHG) emissions and climate change has emerged as a major global concern, driven by the continuous surge in energy demand. This trend exerted significant pressure on the global climate system, as evidenced by United Nations reports indicating that 2024 was among the warmest years on record [1]. In 2023, the electricity and heat production sector was identified as the largest contributor to GHG emissions, accounting for 33.6% of total emissions [2]. In response to this challenge, countries worldwide have committed to tackling this problem through the Paris Agreement in 2015, which set their journey to achieving Net Zero Emissions (NZE), which requires a substantial transition from fossil fuel-based power generation to renewable energy sources, with targets for renewable energy penetration of approximately 60% by 2030 and 90% by 2050 [3].
In accordance with the global commitment, Indonesia has undertaken to accomplish NZE by 2060 or earlier through its Nationally Determined Contribution (NDC). Supporting this target, the government has targeted a renewable energy mix of 23% by 2025 and 31% by 2050, alongside policies such as early phase-out of coal-fired power plants and the accelerated retirement of existing thermal power units [4]. Despite abundant renewable energy potential, utilization remains relatively low, with only 15.630 GW (0.42% of total potential) installed by 2025. Among renewable energy sources, photovoltaic (PV) systems are a highly promising option due to their rapid installation, low operating costs, and favorable solar irradiation conditions in Indonesia, averaging 4.8 kWh/m2/day [5]-[7].
However, the large-scale grid integration of PV systems poses significant technical challenges due to their intermittent nature. These challenges include voltage rises, reverse power flow, increased system losses, and the potential for grid component overload, all of which can disrupt system reliability and stability. Without proper management, these issues can lead to reduced operational efficiency and even system failure. Therefore, hosting capacity analysis is crucial for determining the maximum allowable PV integration in the distribution grid without violating technical constraints [8]. Various optimization algorithms have been applied in hosting capacity studies under IEEE 33-bus to evaluate the performance of the proposed method, such as Genetic Algorithm (GA) [6], Mixed Integer Non-Linear Programming (MINLP) [9], Vortex Search and Chu-Beaslay Genetic Algorithm [10], Modified Jaya Algorithm [11], and Mutated Salp Swarm Algorithm (MSSA) [12].
Several recent studies have investigated the optimization of photovoltaic (PV) integration into the distribution grid to enhance system performance and grid capacity. Shakboua and Aljarrah [6] proposed an optimization of PV hosting capacity studies using the Genetic Algorithm (GA) with an objective to maximize PV penetration while minimizing power losses in the IEEE 33-bus test system. The study considered operational constraints, including bus voltage limits, line loads, and the absence of reverse power flow to the system (substation). The results showed that the proposed method could achieve PV penetration of up to 79.27% and reduce system power losses by 65.54%, demonstrating its effectiveness compared to other optimization techniques. Kaur, Kumbhar, and Sharma [9] proposed a two-phase optimization methodology for the optimal placement and sizing of distributed generation (DG) to minimize power losses in distribution systems. Recognizing that the benefits of DG are highly dependent on both installation location and capacity, the study formulates the problem as a Mixed Integer Non-Linear Programming (MINLP) optimization problem. In order to reduce the search space and computational burden, the proposed methodology divides the optimization process into two phases: the Site Planning Model (SPM) and the Capacity Planning Model (CPM). The SPM identifies candidate buses using the Combined Loss Sensitivity (CLS) index, while the CPM determines the optimal DG locations and capacities by integrating the Sequential Quadratic Programming (SQP) and Branch and Bound (BAB) algorithms. The proposed method was evaluated on the IEEE 33-bus and IEEE 69-bus distribution systems for both single and multiple DG installations capable of supplying either active power alone or both active and reactive power. The results demonstrate that the IEEE 33-bus system with three DG units operating at unity power factor achieves a penetration level of 72.79% while reducing system power losses by 65.5%.
Makawi et al. [11] proposed a modified Jaya algorithm method to determine the optimal size and location of PV systems in radial distribution networks. The objective is to minimize the power losses and improve voltage profiles under high PV penetration levels. The IEEE 33-bus system is used to evaluate the performance of the proposed method. The results show that the algorithm successfully reduced power losses by 56.9% and maintained voltage levels within acceptable limits, even at penetration rates of up to 300%. This method also demonstrates reliable capabilities in handling multi-objective optimization problems with a large number of variables. Montoya et al. [10] proposed a hybrid master-slave metaheuristic technique for the optimal location and sizing of distributed generators (DGs) in radial distribution networks. In the proposed framework, the Chu-Beasley Genetic Algorithm (CBGA) is employed in the master stage to determine the optimal DG solution, while the Vortex Search Algorithm (VSA) is utilized in the slave stage to solve the optimal power flow (OPF) problem for DG sizing. The OPF solution incorporates a successive approximation power flow method to accurately calculate voltage profiles and power losses while maintaining power balance throughout the network. The proposed methodology was validated on the IEEE 33-bus and IEEE 69-bus distribution systems. The results demonstrate that the IEEE 33-bus system achieved an optimal penetration level of 79.32% with a 65.5% reduction in system power losses. Furthermore, after 100 iterations, the method produced maximum, minimum, mean, and standard deviation of power losses of 70.7219 kW, 69.4077 kW, 69.5409 kW, and 0.34 kW, respectively, indicating high solution quality and robustness compared with comparison optimization techniques.
Gholami and Parvaneh [12] proposed the Mutated Salp Swarm Algorithm (MSSA) method for the optimal allocation of shunt capacitors (SC) and distributed generation (DG) in the form of a photovoltaic (PV) system within a distribution system. The objective is to improve distribution system performance through reactive power compensation, voltage profile improvement, and increased network efficiency. The IEEE 33 bus and IEEE 69 bus are used to evaluate the proposed method. The results showed that the algorithm achieved a PV penetration rate of 79.27% and reduced system power losses by 65.54% in the IEEE 33 bus system in a scenario with the installation of three units of PV on three buses without capacitor involvement. Furthermore, the results demonstrated improved system performance in terms of reduced losses, improved voltage profiles, and faster convergence compared to conventional methods.
Despite the effectiveness of GA, MINLP, CBGA-VSA, Modified Jaya, and MSSA in prior hosting-capacity studies, three gaps remain: (i) GWO has not been applied to this problem despite its demonstrated efficiency in other power-system optimization tasks; (ii) most prior studies do not jointly consider voltage limits, line-loading limits, and reverse-power-flow constraints together with candidate-bus pre-selection; and (iii) the effect of inverter power factor on maximum achievable PV penetration has received limited attention. This study addresses these gaps by proposing a GWO-SPM framework that jointly optimizes PV location and capacity under multiple operational constraints and inverter power-factor scenarios. Therefore, this research proposes the Grey Wolf Optimizer (GWO) algorithm to optimize the location and capacity of PV systems in the IEEE 33-bus 20 kV system with the objective of maximizing PV penetration while minimizing system power losses. The analysis takes into account crucial technical constraints, including voltage limits, line load limits, and reverse power flow to the substation. Additionally, candidate bus selection was performed using the Site Planning Model (SPM) to reduce computational burden [9]. The influence of inverter power factor was also incorporated to providing the comprehensiveness analysis. The simulation was performed using MATPOWER within the MATLAB software. The results of this study are expected to provide practical insights for distribution system planning in determining optimal PV integration strategies and supporting the achievement of NZE targets through increased renewable energy penetration.
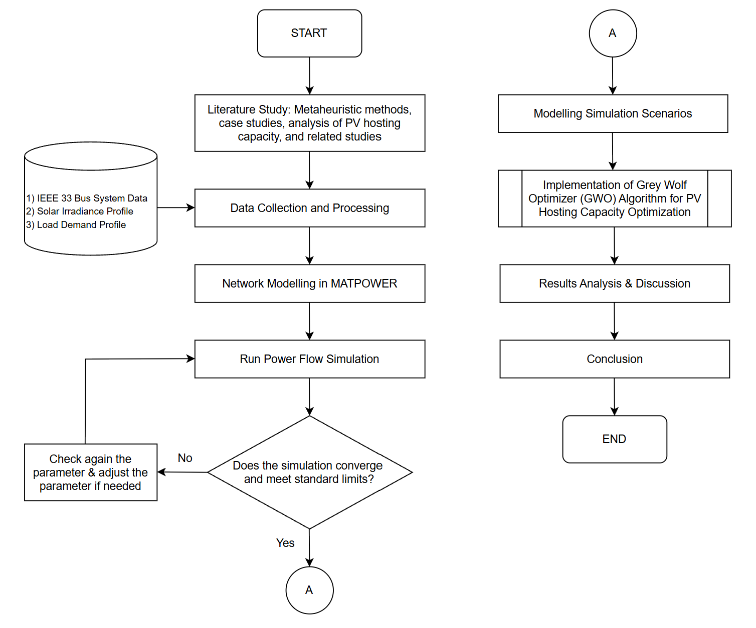
The research flowchart is depicted in Fig 1. The simulation was fully conducted on MATPOWER. The process begins with network modelling and impedance base conversion. Then, a power flow analysis was performed to verify network convergence. A PV hosting capacity study was then conducted under various simulation scenarios by evaluating the effects of the number of PV units and inverter power factor settings. Subsequently, candidate buses for PV installation were identified using the Site Planning Model (SPM). The Grey Wolf Optimizer (GWO) algorithm then determined the optimal PV locations and capacities within the reduced search space, subject to voltage, line loading, and reverse power flow constraints. The resulting optimal solutions were evaluated across the defined inverter power factor and PV unit scenarios, followed by robustness testing to evaluate the quality and consistency of the results the algorithm produced, as well as analysis of system impacts on voltage profile, line loading, losses, and substation power.
The proposed method in this research used an IEEE 33-bus test system, which has been modified to operate at a base voltage of 20 kV. This network and operating voltage were selected because it represents a typical distribution system in Indonesia, which is generally a radial network topology and operates at a medium voltage of 20 kV. Since the base voltage was modified from 12.66 kV (original operating voltage of the IEEE 33 bus system) to 20 kV, the line impedance parameters must be adjusted to ensure that the network continues to represent the same physical conditions despite the change in voltage base.
This adjustment was performed by converting the line resistance and reactance values into per-unit (p.u) based on the new voltage base. This step is necessary due to MATPOWER expressing line parameters in per-unit form. The first step in converting the line impedance values into per-unit quantities with a new voltage base was to determine the base impedance as shown in (1).
| (1) |
where  is the base impedance
  is the base voltage (kV), which is 20 kV as the nominal voltage used, and
  is the base apparent power (MVA), which is 10 MVA as the apparent power of the system.
Subsequently, the impedance values in per-unit (p.u) were calculated using the formulation given in (2), based on the actual impedance data of the system.
| (2) |
where  is the per-unit line impedance,
  is the actual line impedance (
 ), and is the base impedance () calculated using (1), which is 4 [13]. Then, the value of the base impedance serves as the divisor for the actual impedance value in the standard IEEE 33-bus test system data [14].
The Grey Wolf Optimizer (GWO) is a metaheuristic optimization algorithm inspired by the social behavior and hunting strategies of grey wolf packs (canis lupus) in nature. In their social hierarchy, grey wolves have a leadership hierarchy consisting of alpha, beta, delta, and omega. In the optimization process, the first best solution is considered the alpha, the second best solution the beta, and the third solution is considered the delta. Other solutions will follow these three best solutions until a global optimum solution is found [15].
The implementation of the GWO algorithm in this study involves a population consisting of N grey wolves predefined to explore a d-dimensional search space. The wolf’s position is expressed as a decision vector containing information on the PV installation buses and the capacity allocated to each location. All candidate solutions are evaluated using an objective function with a penalty score applied to solutions that violate the predefined technical constraints. During the optimization process, the three best candidate solutions, determined based on their fitness value, are designated as α, β, and δ wolves, respectively, while all other candidate solutions are classified as ω wolves. The prey represents the optimal solution being sought, and its position is approximated by the position of the α wolf, which corresponds to the best solution found so far. Fig. 2 shows a flowchart illustrating how the GWO algorithm works in this research study.
The parameters used for the implementation of the proposed algorithm in this study are depicted in Table 1. The population size and maximum iteration count were selected through preliminary trial runs to investigate the trade-off between solution quality and computational cost. Three representative population sizes (10, 20, and 30 wolves) and three iteration limits (50, 100, and 150 iterations) were chosen to represent low, medium, and high search efforts, respectively. A smaller population or fewer iterations may lead to premature convergence because of insufficient exploration of the search space, whereas larger values generally improve exploration at the expense of increased computational time. Based on the preliminary results, a population of 20 wolves with 100 iterations consistently achieved convergence while requiring substantially less computational effort than the largest parameter combination.
Parameters | Value |
Wolves population | 20 |
Iteration | 100 |
Foul penalty | 106 |
The problem formulation was obtained by finding the objective function to be optimized. In many papers, the objective function only focused on how to maximize the penetration of PV in the system, but in this research, consideration was added to minimize the system power losses. The objective function was shown in (3), where the values of A and B serve as weighting factors for the sensitivity of changes in total power losses and PV penetration, thereby yielding an optimal solution. The problem formula in this study was looking for a minimal function as expressed mathematically in (3), where the negative sign makes the objective function minimize when the PV penetration increases [6].
| (3) |
where F is the objective function,  is the total system power loss (MW),
  is the installed capacity of the (i)-th PV unit (MW), N is the total number of PV units, and A and B are weighting factors assigned to the power loss and PV penetration terms, respectively.
The weighting factors A and B were 1,000 and 1, respectively [6]. The value of 1,000 for the weighting factor A was chosen to convert system power losses from MW to kW, so a small change in system power losses can increase the sensitivity of the function in reducing its value. Meanwhile, the value of 1 for the weighting factor B was chosen to allow the algorithm to converge faster with a high success rate.
The limiting factors can influence the PV hosting capacity study. Therefore, these limiting factors should be carefully formulated as constraints in the optimization problem, ensuring the obtained results remain within the permissible operating limits of the network. These constraints were:
| (4) |
| (5) |
The active power injected by PV  a distributed generation source was less than the total active power of the demand load (
 to ensure there was no reverse power flow back into the system or the substation.
| (6) |
The Site Planning Model (SPM) was developed to identify the most potential candidate locations for the placement of distributed generation (DG) units within a distribution network. The SPM has the purpose of reducing computational burden by narrowing down the search space. The sensitivity of apparent power loss with respect to
real and reactive power injection was expressed as shown in (7) [16], [17].
| (7) |
where  is the apparent power loss (VA),
  is the active power loss (W),
  is the reactive power loss (var),
  is the active power injection at bus
  ,
,  is the reactive power injection at bus ,
  denotes the bus index, and
  is the imaginary unit. The combined Loss Sensitivity (CLS) is then calculated as shown in (8) [17].
| (8) |
Finally, all buses were ranked according to their CLS values, and the top 30% (10 buses in the IEEE 33-bus system) were selected as candidate locations for PV installation.
A study on the optimization of PV hosting capacity basically involves repeatedly running load flow simulations using an algorithm that takes into account predefined constraints and an objective function. The load flow simulation in this study was conducted under a worst-case scenario, defined as the condition in which PV as distributed generation (DG) operated at maximum output, while the load demand remained relatively low. This condition was selected due to its high potential to violate the limiting factors, such as rising voltage profile, overloading of distribution lines or distribution transformers [8].
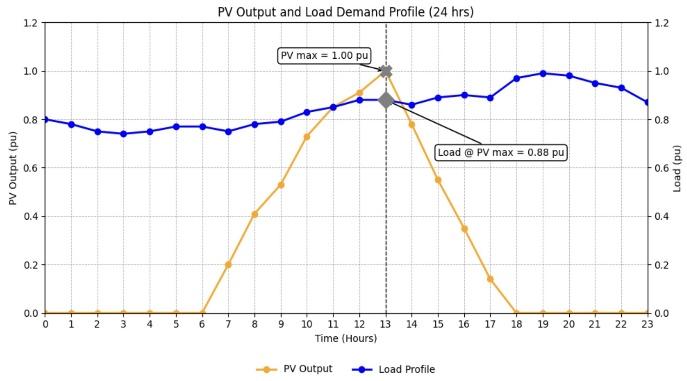
This study used actual PV output data from the Surakarta region, along with the load demand profile of the MKN-05 feeder in Surakarta [18]. As depicted in Fig 3, the analysis was performed at 1:00 PM, corresponding to a PV output of 1 p.u and a load demand of 0.88 p.u.
Simulations were conducted under multiple scenarios to address the research objectives. Inverter power factor setting was considered to assess the influence on the maximum penetration value of hosting capacity. The power factor of 0.95 lagging and a unity power factor were selected for the scenario simulations. Furthermore, each power factor scenario will be installed with one to three PV units to evaluate the impact of PV distribution on the hosting capacity results. The detailed simulation scenarios were presented in Table 2.
1 PV | 2 PV | 3 PV | |
PF = 1 | Scenario 1 | Scenario 2 | Scenario 3 |
PF = 0.95 | Scenario 4 | Scenario 5 | Scenario 6 |
The results of the PV hosting capacity optimization in this study include the optimal bus location, PV penetration rate, and the percentage reduction in power losses in the system compared to the base case scenario (without PV). The penetration rate represented the PV active power injection (PPV) divided by the total system load demand (PLoad) in Watts. Mathematically, this value can be expressed in (9).
| (9) |
Meanwhile, the percentage of power loss reduction was defined as the decrease in system power losses following the injection of PV power into the system. Mathematically, this value can be expressed in (10).
| (10) |
where Ploss, initial represented the system’s active power losses under the base case scenario (Watt), and Ploss, final represented the system’s active power losses after the optimized PV power has been injected into the system (Watt).
The robustness analysis was conducted to evaluate the consistency of the solutions produced by the proposed optimization algorithm. Since the Grey Wolf Optimizer (GWO) is a stochastic optimization algorithm, the optimization process was independently repeated 51 times for each simulation scenario to assess the stability of the obtained solutions [19]. The algorithm's robustness was evaluated using four statistical measures, namely the mean, standard deviation, range, and coefficient of variation (CV). A smaller CV indicates that the optimization algorithm consistently produces similar solutions and therefore exhibits
greater robustness. These statistical measures are expressed in (11)-(14) [20].
| (11) |
where  is the mean value of the optimized PV active power injection (MW),
  is the optimized PV active power injection obtained from the -th independent simulation run (MW), and
  is the total number of independent simulation runs.
| (12) |
where  is the sample standard deviation, is the optimized PV active power injection obtained from the -th simulation run, is the mean value of the optimized PV active power injection, and is the total number of independent simulation runs.
| (13) |
where  is the range of the optimization results,
  is the maximum optimized PV active power injection (MW), and
  is the minimum optimized PV active power injection (MW).
| (14) |
where  is the coefficient of variation (%),
  is the sample standard deviation, and is the mean value of the optimized PV active power injection.
Finally, the robustness of the proposed GWO algorithm was assessed based on the coefficient of variation, where a lower CV indicates a smaller variation among independent simulation runs and, consequently, a more stable and reliable optimization performance.
The study used MATPOWER as the optimization tool to evaluate the proposed algorithm in a PV hosting capacity study based on predefined objectives and operational constraints. This section presents the optimization results, highlighting the impact of PV injection on system performance, including voltage profiles, line loading, power losses, and the influence of the PV inverter power factor on the PV hosting capacity results.
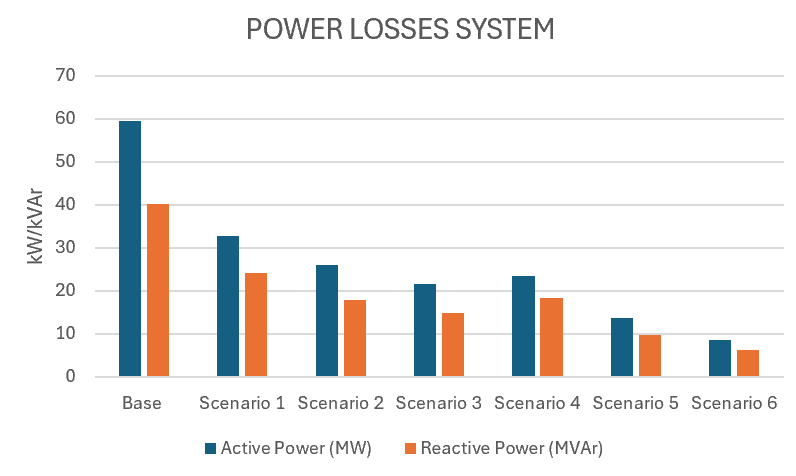
A power flow analysis under the base case scenario was first conducted to ensure system convergence and compliance with standard operating limits as in the grid code. Under the worst-case scenario (0.88 p.u load profile), the simulations resulted in a total active power of 3.2692 MW and reactive power of 2.024 MVAr, with corresponding system losses of 59.469 kW and 40.189 kVAr. Then, optimization was executed over 100 iterations using 10 candidate buses provided by the SPM study, which are [5, 6, 8, 9, 10, 13, 24, 28, 29, 30] [16], [17]. Those candidate buses were chosen to reduce the search space, so as to improve efficiency and timing optimization.
The optimization results presented in Table 3 correspond to the best maximum penetration achieved from five simulation runs conducted for each scenario to evaluate the robustness of the algorithm. The highest performance was obtained with three PV units operating at a 0.95 lagging inverter power factor, achieving 87.99% PV penetration and reducing system power losses by 85.57%. Furthermore, it was observed that the increase in the inverter power factor to unity leads to reduced maximum achievable PV penetration, as the reduced reactive power support weakens voltage regulation and increases the risk of overvoltage, thereby limiting the PV hosting capacity.
In this subsection, an impact study was conducted on the integration of the optimized PV hosting capacity, as in
Table 3, with respect to several power system parameters, such as bus voltage profiles, line loading, power losses, and power supply from the substation as an indicator of the absence of reverse power flow.
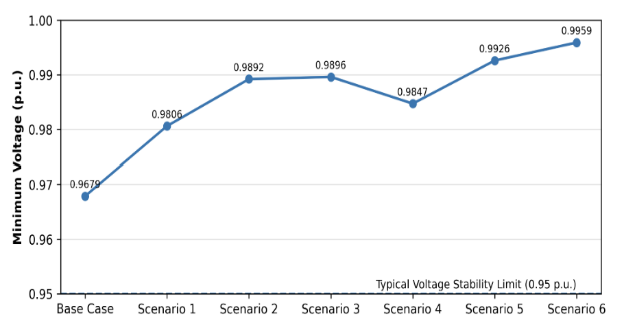
The bus voltage profiles in all simulation scenarios remained within the grid code limits, ranging from 0.9679 to
1 p.u. Therefore, Fig 4 presents the minimum bus voltage observed in each scenario. The results show an increasing trend in minimum voltage as PV integration increases, indicating that the optimized PV installation contributes to improving the system voltage profile while maintaining compliance with operational voltage limits. Additionally, the figure shows that scenario 6 achieved the best voltage profile improvement, which was due to the reactive power support provided by the PV inverter operating at a 0.95 lagging power factor. The injected reactive power helps compensate voltage drops along the feeder, resulting in enhanced voltage regulation and a more uniform voltage profile across the distribution network.
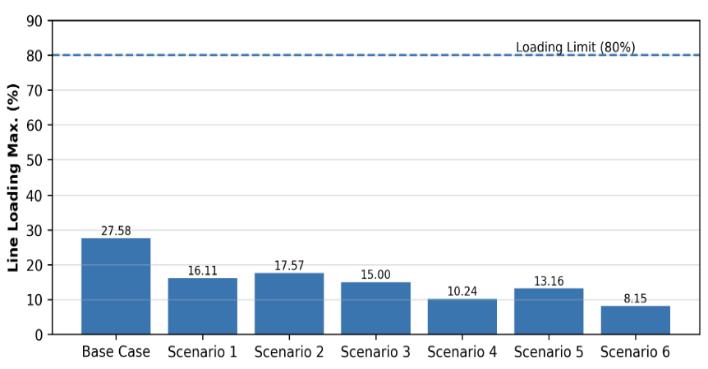
The line loading profiles optimized by this study were far from the normal system operating limits. Thus, Fig 5 shows the maximum line loading for each simulation scenario. A downward trend was observed across the simulation scenarios, with the maximum reduction in line loading reaching 70.45% of the base case scenario, which demonstrates the effectiveness of the optimized PV allocation and reactive power support in relieving feeder loading and improving network operation margins.
System power losses are defined as the electrical energy lost during the process of transmitting power from the source to the load due to the network impedance. The system power losses optimized by PV hosting capacity in this study, as shown in Fig 6, exhibit a significant downward trend. This is because optimizing the placement and capacity of PV systems reduces power flow in the grid and minimizes system power losses. The most significant reduction occurred in scenarios 4-6, because the power factor setting of 0.95 lagging inverter provided reactive power support, which substantially reduced the loading on the lines.
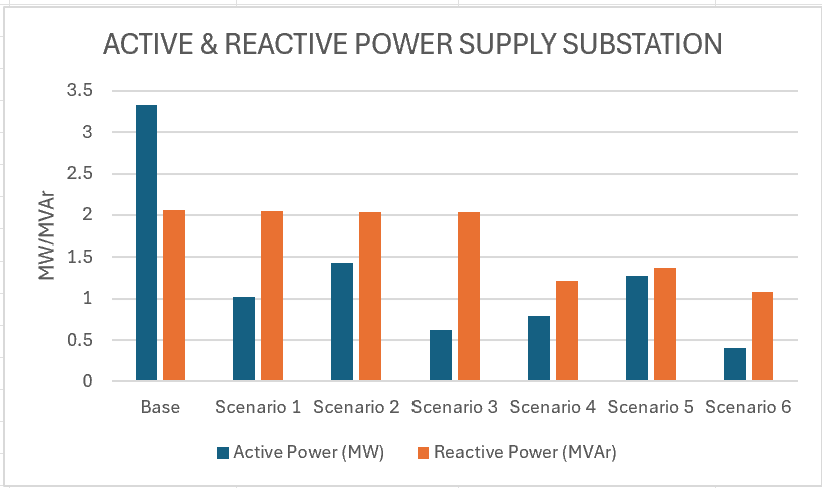
The power parameters supplied by the substation were analyzed to verify that the results of the PV hosting capacity optimization did not cause reverse power flow. Fig 7 shows the power supplied by the substation after PV integration in each optimization scenario. All power values were on the positive Y-axis, indicating that no reverse power flow occurred toward the substation. Furthermore, a significant downward trend in the substation’s power supply was observed as PV penetration increased, indicating that partial load demand has been met locally by the PV generation. These results demonstrate that the optimization solution meets the specified operational constraints while improving the efficiency and reliability of the distribution system’s operation.
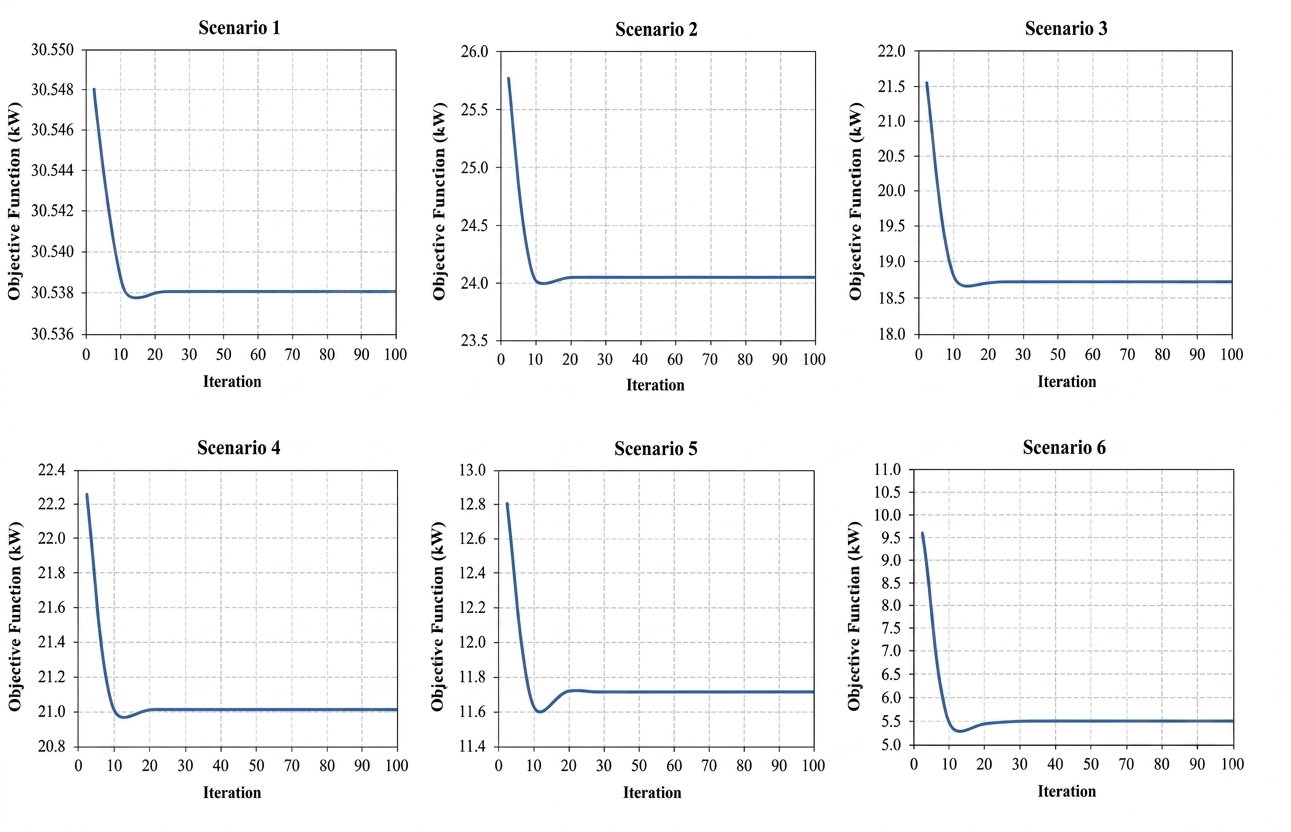
The simulation was conducted 51 times for each scenario as a sample to evaluate the algorithm’s robustness, in order to assess the stability and consistency of the proposed algorithm. The results demonstrate that the algorithm is robust, with an average coefficient of variation (CV) below 5%, indicating low variability in the obtained solutions. In addition, the algorithm showed relatively fast computational performance, with an average execution time of 97.5 seconds, as presented in Table 4. It should be noted that these robustness results are specific to the modified IEEE 33-bus 20 kV system evaluated in this study; performance may vary on networks with different topology, feeder length, or load characteristics. Furthermore, the convergence curve of the algorithm, depicted in Fig 8, shows a consistent decreasing trend across all scenarios with stabilization occurring around 15–20 iterations. Because all 51 independent runs per scenario converged to solutions within a narrow range (CV < 5%, Table 4) rather than becoming trapped at different local optima, this pattern was consistent with an absence of premature convergence.
Mean (MW) | Std. Deviation (MW) | Range (MW) | CV (%) | Computational Time (s) |
2.36860 | 0.09474 | 0.49558 | 3.99883 | 97.5027 |
The comparison performance of the proposed Grey Wolf Optimizer (GWO) with several optimization algorithms for determining the optimal PV placement and sizing is depicted in Table 5. Under the unity power factor (PF) inverter setting, GWO achieves the highest PV penetration of 81.77%, exceeding GA (80.16%), MINLP (72.79%), Jaya Algorithm (78.71%), CBGA-VSA (79.32%), and MSSA (79.28%). As a result, the grid dependency is reduced to 18.23%, representing the lowest value among all compared methods. Moreover, GWO identifies the same optimal PV placements, namely Buses 13, 24, and 30, as most benchmark algorithms, except for the Jaya Algorithm, indicating that the proposed method is robust and consistent in determining the optimal locations based on the formulated objective function and network constraints. Although the loss reduction achieved by GWO (63.28%) is slightly lower than the comparison methods, GWO can still provide a competitive and near-optimal solution while requiring a simpler parameter configuration than many other algorithms.
Performance of GWO improves significantly when the PV inverter operates at a 0.95 lagging power factor. The PV penetration increases from 81.77% to 87.99%, and the loss reduction rises from 63.68% to 85.57%. These improvements indicate that the reactive power support enhances voltage regulation, mitigates network constraints, and enables greater PV integration into the distribution network.
Algorithm | PV Location | PV Size (kW) | PV | Losses Reduction (%) | Griddep (%) | ||||
Jaya [11] | 14 | 24 | 30 | 755.6 | 1,097.04 | 1,071.6 | 78.71 | 66.13 | 21.29 |
*MINLP [9] | 13 | 24 | 30 | 801.8 | 1,091.3 | 1,053.6 | 72.79 | 65.50 | 20.68 |
*GA [6] | 13 | 24 | 20 | 807.4 | 1,120.3 | 1,050.2 | 80.16 | 65.40 | 19.84 |
*CBGA-VSA [10] | 13 | 24 | 30 | 801.8 | 1,091.3 | 1,053.6 | 79.32 | 65.50 | 20.68 |
*MSSA [12] | 13 | 24 | 30 | 801 | 1,091.1 | 1053 | 79.28 | 65.50 | 20.72 |
GWO (Unity PF) | 13 | 24 | 30 | 703.2 | 1,009.3 | 960.7 | 81.77 | 63.68 | 18.23 |
GWO (0.95 lagging PF) | 13 | 24 | 30 | 739.8 | 1,046.9 | 1,089.7 | 87.99 | 85.57 | 12.02 |
*Mixed Integer Non-Linear Programming (MINLP), Genetic Algorithm (GA), Chu-Beaslay Genetic Algorithm (CBGA) – Vortex Search Algorithm (VSA), Mutated Salp Swarm Algorithm (MSSA). | |||||||||
This paper presents the implementation of the Grey Wolf Optimizer (GWO) algorithm to determine the optimal location and capacity of a photovoltaic (PV) system in a distribution network, considering hosting capacity limitations and technical operational constraints. The optimization results show that GWO was capable of providing optimal solutions across all tested scenarios, achieving penetration rates of 87.99% and a power loss reduction of 85.57% in a scenario involving three PV installations on three busbar candidates with an inverter power factor setting of 0.95 lagging. Furthermore, PV integration has a significant impact on the grid’s technical operational parameters, where an increase in PV penetration was directly proportional to an increase in bus voltage profile and inversely proportional to line loading, system power losses, and power supply from the substation. Furthermore, the power factor of PV inverters near the unity power factor will reduce the maximum achievable PV penetration observed in this study. Overall, within the scope of the modified IEEE 33-bus 20 kV test system and scenarios evaluated, the results indicate that PV integration optimized using GWO can improve efficiency, enhance voltage quality, and maintain reliability within permitted operating limits. Generalization to other distribution networks or operating conditions requires further validation. This study has several limitations. The evaluation was conducted solely on a modified IEEE 33-bus system under a single worst-case operating point (1:00 PM). Future work should validate the proposed method on larger or real-world distribution networks, incorporate time-series PV and load uncertainty, and benchmark GWO directly against more optimization algorithms under identical test conditions.
The authors would like to express their sincere gratitude to all individuals and institutions who have contributed to the completion of this research. Their valuable guidance, constructive discussions, technical support, and encouragement have significantly contributed to the development of the optimization of photovoltaic (PV) hosting capacity study. The authors also acknowledge the continuous support and understanding provided by their families throughout the research process. Their encouragement and motivation were instrumental in the successful completion of this work. Hopefully, this research will be useful for distribution network planners to plan strategies for integrating renewable energy sources into the distribution network without violating or deteriorating technical parameters.
Syah Ridho Natiqoh, Optimization of Photovoltaic (PV) Hosting Capacity in 20 kV Distribution System Using Grey Wolf Optimizer (GWO) Algorithm