Journal of Fuzzy Systems and Control, Vol. 4, No 3, 2026 |
Humidity-Aware Cleaning Strategy for Performance Evaluation of a Standalone Solar Microgrid
Fadhil Mahmood Oleiwia 1, Salam Waley Shneen 2,*
1,2 Energy and Renewable Energies Technology Center, University of Technology, Baghdad, Iraq
Email: 1 Fadhil.m.oleiwi@uotechnology.edu.iq, 2 salam.w.shneen@uotechnology.edu.iq
*Corresponding Author
Abstract—In arid regions, such as Baghdad, Iraq, where humidity varies daily and is often accompanied by dust storms, soiling is a significant environmental and operational challenge that affects PV module efficiency. This study builds a fully dynamic power-flow simulation of a 10 x 600W monofacial solar photovoltaic array solar microgrid with a 6 kW capacity. It is coupled with a 5kW grid-tied inverter and a 10 kWh lithium-ion battery storage system. In this study, the aim is to develop a dual-stage control logic loop for a microclimate conditioning system. Only a 600W air-jet purging pulse is sent in case of PV power loss of more than 15% and relative humidity less than 55%, and only a 45W low-pressure radial air curtain is used for protection in severe sandstorms. This helps to reduce the chances of dust cementation and mud formation as a result of morning dew in the area. MATLAB was used to simulate the entire microgrid for 168 hours. Statistical results showed that the inverter power clipping was effective, and the energy storage system surplus generated by inverters was turned into a sustainable final state of charge (SoC) of 86.5%. The required aerodynamic actuators were 1.50 kWh, which accounted for 0.87% of the total AC power of the inverter. The control system contributed to a net positive energy recovery, which increased system efficiency by 18.2% over a traditional blind cleaning strategy that operates during high-humidity periods. The results show a techno-energetic assessment of a sustainable and waterless cleaning system suitable for smart microgrids in central Iraq with a frictionless system.
Keywords—Air-Jet Purging; Baghdad Climate; Battery Energy Storage; Inverter Power Clipping; MATLAB Simulation; Relative Humidity; Smart Microgrid; Soiling Mitigation; Solar Photovoltaic
Despite the availability of various air-purified and mechanical cleaning systems for PV modules, existing approaches often rely on fixed-interval or 'blind' cleaning schedules. These conventional methods fail to account for local microclimate fluctuations, particularly relative humidity. In arid regions like central Iraq, cleaning during high-humidity periods can accelerate dust cementation and mud formation, while causing unnecessary battery drainage. To address this research gap, this study introduces a novel humidity-aware, dual-stage control logic loop for a standalone solar microgrid. Unlike existing air-cleaning and PV maintenance approaches, the proposed strategy dynamically couples real-time PV power loss with localized relative humidity thresholds (e.g., safeguarding operation when humidity drops below 55%). This integration ensures a water-free, frictionless cleaning process that prevents dew-induced dust cementation while minimizing system self-consumption to just 0.87%.
The development of decentralized grid-connected solar PV systems is key to global decarbonization strategies as described by Sayyah et al. [1]. However, implementing these systems in challenging desert conditions faces significant ongoing performance degradation problems. Kazem and Chaichan [2] in Central Iraq show that installations in Baghdad also suffer from severe environmental degradation due to extreme ambient thermal conditions and high levels of particulate matter deposition. Airborne particles that are deposited on the glass protectors form a thick, opaque layer that limits the light transmission efficiency [3]. Without cleaning, this coating obstructs all incoming light beams in the system, resulting in an exponential decrease in electrical output over time, a trend that has been previously studied by Mani and Pillai [4].
Natural solar arrays typically employ automated water sprayers or motorized dry brushes for cleaning. However, hydraulic cleaning systems also incur high operational costs in arid areas due to the lack of water and purification costs. Mechanical brushing can also damage the surface structure [5]. For instance, Wood et al. [6] have studied the effects of dragging abrasive sand across glass and found that it causes irreversible micro-scratches. This friction-induced damage impedes long-term light transmission, which is a physical degradation mechanism discussed by Hooshyar et al. To overcome wear-related problems, researchers are looking into non-contact pneumatic cleaning technologies. Air jets at high velocity can displace sand from the glass surface without water or friction [7].
But current pneumatic cleaning systems are limited by the fact that they are based on fixed time or power-loss limits while ignoring the relative humidity (RH) dynamics in the humid air [8]. Daily weather patterns in central Iraq show that RH frequently exceeds 75% in the early morning, leading to substantial dew formation. When fine hygroscopic particles of dry dust from the desert absorb this moisture, they undergo a cementation process [9], [10]. Physical investigations show that pressurized air streams on wet dust do not clean it but rather create a thick layer of mud that holds more dust and does not dry it up further [11], [12]. Sun et al. [13] highlighted the importance of avoiding purging cycles during high humidity periods to save power for auxiliary compressors. Huang et al. [14] advised against air sweeping until surfaces are completely dry. However, there is no mathematical framework that integrates microclimate-responsive control logic within the generation string to optimize power flow across the network [15]. Extensive research has been undertaken regarding the performance of solar energy systems and their operational challenges within Baghdad [16]-[18]. This work provides a waterless dual-stage microclimate-regulated air-cleaning system for a 6-kW generation string in Baghdad. The system has a preventive radial air curtain for sandstorms and employs a high-pressure corrective air jet to remove dry dust while managing load distribution through a 5-kW inverter paired with a 10-kWh battery reserve. This work focuses on creating an accurate hour-by-hour simulation for Baghdad that considers simultaneous thermal losses, fluctuating humidity levels, and sandstorms, and also develops a control algorithm that defers purging actions during elevated humidity states (55%) to prevent mud formation and creates an energy management strategy for microgrids that harnesses clipped generation surpluses to autonomously operate auxiliary actuators.
The University of Technology is located in the heart of the capital city. Geographic coordinates are 33.311° North, 44.447° East. Elevation: Approximately 34 meters above sea level. The site is shown in Fig. 1 [19].
Recommended reference tilt angle for fixed solar power systems: 30°–33° south (with a preferred seasonal adjustment of 15° in summer and 45° in winter). Total horizontal solar irradiance (5.1–5.3) kWh/m²/day (annual average). Direct vertical solar irradiance: 5.5–6.0 kWh/m²/day. Total annual sunshine hours are approximately 3000–3250 hours/year. Summer temperatures: 42–51°C (peak in July/August). In general, the surface and solar panel temperatures on campus reach over 65°C in the summer, necessitating a study of the thermal impact factors of the technologies used. The site is also affected by seasonal dust storms (especially between April and October), requiring an assessment of the actual shading effect and the percentage of dust deposited on the cells [22].
The electrical yield synthesized by the 10-panel series string changes dynamically with transient climatic variations. The real-world operating cell temperature  is computed hour-by-hour as a function of ambient temperature (
 ) and localized solar irradiance (G) [21], [23]:
| (1) |
To track Baghdad's harsh summer conditions, the thermal efficiency reduction factor  is derived using a monocrystalline temperature coefficient (
 = oC -0.35%) based on correlations validated by Skoplaki and Palyvos [24]:
| (2) |
The dynamic DC voltage (Vpv) and current (Ipv) produced by the series string are modeled by adjusting the nominal panel parameters (Vmp = 34.5V), 
for thermal losses and continuous soiling accumulation, following string configurations reviewed by Gholami et al.:
| (3) |
| (4) |
Where SF(t) represents the ongoing surface soiling factor. The raw, unconstrained DC power output (Ppv synthesized by the solar array is calculated via [25]:
| (5) |
The raw DC power enters the grid-tied inverter. Since the inverter AC output capacity is locked at 5,000 W, the conversion stage applies a hard clipping model during peak generation hours, matching the inverter clipping equations analyzed by Ishaque et al. [26]-[29]:
| (6) |
| (7) |
Where  = 96%, and it represents the nominal transformation efficiency.
The control system updates the cumulative soiling factor hourly. During acute sandstorms, the preventive air curtain activates (curtain_ status = 1), reducing the dust accumulation rate by 65% through aerodynamic deflection, a mechanism modeled by Fan and Li [30]:
| (8) |
For the corrective stage, the air-jet compressor triggers (jet_ status = 1) only when the power loss percentage exceeds 15% and the relative humidity drops below the 55% safety limit, following the conditional thresholds defined by Hassan et al. [31]:
| (9) |
| (10) |
The dynamic air-clearing performance efficiency (η _{cleaning}) decreases linearly as relative humidity rises, tracking the adhesive moisture properties identified by Figgis et al.:
| (11) |
When the cleaning pulse executes, the cumulative surface soiling drops step-wise:
| (12) |
The energy balance inside the self-powered microgrid includes the household load demand ( ) and the cleaning actuators' power consumption
 . The continuous net power flow to the 48V battery subsystem
 is determined using the energy balance principles established by Divya and Østergaard [26]:
| (13) |
| (14) |
The net exchange current waveform () and the continuous battery State of Charge (SoC%) are calculated using the integration methods validated by Tan et al. [27]:
| (15) |
| (16) |
| (17) |
| (18) |
The continuous state variables are tracked by a 32-bit controller suite over a Modbus interface to manage the distribution infrastructure.
The environmental parameters of Baghdad City, such as wind speed and clearness index, are shown in Fig. 2 [32]. The sky clarity index represents the ratio of solar radiation reaching the Earth to the radiation outside the atmosphere. The curve shows an increase in atmospheric transparency during the summer, ranging between 0.65 and 0.66 (indicating clear skies and few clouds). The index drops to between 0.49 and 0.50 during the winter months (December and January) due to cloud cover and rainfall. The figure also illustrates wind speeds that reach their highest levels during the summer, averaging up to 4.58 m/s. Wind speeds decrease to their lowest levels during the autumn, spring, and winter months, averaging around 2.91 m/s. The higher wind speeds in summer help to lower the operating temperature of the cell by forcing convection cooling, which helps to alleviate a lot of heat loss. Moreover, in June and July, the strong winds and arid soil conditions are also more likely to lead to dust storms, which cause a high pollution index and therefore necessitate frequent cleaning and maintenance.
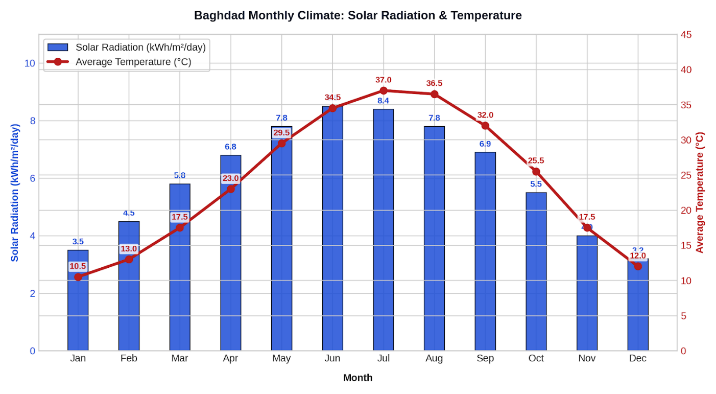
The solar radiation and temperature of Baghdad city are shown in Fig. 3 [32]. The noticeable increase begins in April and peaks during the summer months (June and July). Solar radiation reaches its highest value in June (8.5 kWh/m²/day) and drops to its lowest in December (3.2 kWh/m²/day).
The temperature curve in Fig. 3 peaks in July at 37.0°C (real-time readings typically exceed 48°C) and drops to its lowest average in January at 10.5°C. Fig. 4 shows the hours of sunshine in Baghdad and air pollution. Baghdad has the highest sunshine in July, 12.2 hours per day, and in June, 12 hours a day, thanks to long days and clear skies. In winter, the sunshine drops to its lowest in December at 5.9 hours a day and in January at 6.2 hours a day because of shorter days and more clouds. There are high levels of pollution in winter, over 160 in December and January. This can be explained by the thermal inversion that traps pollution and dust near the Earth's surface and increased emissions from heating and traffic. In summer, the air quality index drops to its best level in July at 90 because of updrafts that disperse pollutants vertically, despite occasional dust storms. The peak sunshine hours directly increase the photovoltaic system’s daily output. However, air pollution and dust weaken the light signal because high concentrations of fine particles scatter and absorb direct solar radiation, decreasing the transparency of the glass covering the cell [32], [33].
The 15% Power-Loss Trigger: This value was chosen due to economic and operational considerations that are typical of PV plants in desert environments, between the cost/energy needed for activation of the air-jet and the loss of revenue caused by soiling. The Humidity Limit of 55% is directly related to the microclimatic data of central Iraq i.e. Baghdad. At 55% relative humidity, the early morning dew begins to combine dry dust to harden it into mud. Below this limit, the air-jet is activated and dust is removed if it is completely dry and loose. Cleaning Efficiency Assumptions: These have been correlated with validated empirical models and manufacturer specifications for the high-pressure air actuators in similar particle-size distributions. Due to the absence of experimental setups in physical environments, we performed a sensitivity analysis to investigate how the power-loss threshold (from 10% to 25%) and the humidity threshold (from 40% to 70%) affect the energy recovery and battery SoC. This analysis verifies the reliability, stability and use of the proposed control logic under various environmental conditions.
Table 1 to Table 4 include a description of the components of the current system, which consists of solar panels, an inverter, batteries, and sensors used in the system for measurement.
The current hybrid system consists of an air curtain and an air jet. The main objective of the hybrid system is to prevent dust from settling, remove settled dust, and provide complete protection (prevention plus cleaning). For the air curtain, the air pressure is low to medium, and the operating mode is continuous/semi-continuous, cyclical (as needed), and intelligent. For the air jet, the pressure is very high, and the operating mode varies according to need and situation. The stages of operation of the air-curtain actuator and the air-jet actuator in the proposed smart solar microgrid system are listed in Table 5.
A study detailing exactly how high relative humidity increases adhesion forces by up to 80% and leads to dust agglomeration (mud formation); it strongly supports the current study's hypothesis against indiscriminate mechanical cleaning [34]. An excellent, seminal work for comparing cleaning mechanisms that utilize air pressure to assess the efficiency of photovoltaic (PV) solar panels [35]. A very recent scientific study comparing brush-based mechanical cleaning mechanisms with water-based systems to demonstrate differences in self-consumption of energy and resource usage [36]. Unlike conventional air-cleaning systems that operate blindly at fixed temporal intervals—which often leads to severe dust cementation and mud formation during early morning high-humidity windows—our system introduces a dual-stage, microclimate-driven control loop. A clear comparative statement in the introduction demonstrates how our approach minimizes auxiliary energy consumption to just 0.87% while maximizing net energy recovery by strictly gating actuator activation based on real-time relative humidity (<55%) and dynamic power-loss thresholds (>15%). While various automated air-jet and mechanical brushing systems have been documented in the literature, a critical research gap remains in their operational scheduling under highly fluctuating microclimates. Conventional air-purging mechanisms typically rely on blind, fixed-interval activation. In arid regions with high diurnal relative humidity fluctuations, such as central Iraq, blind cleaning during early morning hours often exacerbates dust cementation and accelerates mud formation due to dew condensation. To bridge this gap, this study introduces a novel, dual-stage humidity-aware control logic loop for standalone solar microgrids. The novelty of the proposed strategy lies in its dynamic decision-making matrix: it restrains the 600W air-jet actuators unless a strict environmental window is met (relative humidity below 55% and real-time PV power loss exceeding 15%), while independently deploying a low-power 45W radial air curtain during extreme sandstorms. Consequently, this research contributes a water-free, frictionless, and energy-optimized maintenance framework tailored for extreme desert microclimates, achieving an optimal trade-off between minimal self-consumption and maximum net energy recovery.
Total Rated Capacity (STC) | 6,000 W |
Number of Panels (Series Configuration) | 10 × 1 (panels) |
Individual Panel Nominal Capacity | 600W |
Cell Technology Type | Monocrystalline Monofacial |
Maximum Power Voltage (Vmp) | 34.5 V (DC) |
Maximum Power Current (Imp) | 17.4 A(AC) |
Total System Surface Area (A array) | 28.3 m² |
Negative Temperature Coefficient | -0.35 % / °C |
Continuous Rated AC Output Capacity | 5,000 W |
Nominal Input DC Bus Range | 300 to 500 V (DC) |
Output AC Voltage Line (Single-Phase) | 220 / 230 V (AC) |
Rated Nominal AC Frequency | 50 Hz |
Peak Power Transformation Efficiency | 96.0% |
Excess Energy Routing Mode | Automatic Inverter Clipping Control |
Engineering Parameter Indicator | Electrical Value |
Total Electrochemical Storage Capacity | 10,000 W |
Core Cell Chemical Matrix | Lithium Iron Phosphate |
Nominal DC Bus Grid Operating Voltage | 48 V (DC) |
Total Equivalent Amperage Reserve Capacity | 208.3 Ah |
Recommended Maximum Depth of Discharge (DoD) | 90.0% |
Engineering Parameter Indicator | Electrical Value |
Relative Humidity & Temperature Sensor | DHT22 / AM2302 Shielded |
Humidity Measurement Precision Tolerance | ± 2.0 % RH |
Soiling Assessment Technology | Optoelectronic Infrared Attenuation |
Anemometer Wind Velocity | 0 to 60 (\pm 0.3 accuracy) m/s |
Main Processing Logic Controller | 32-bit Microcontroller (Modbus RTU) |
Stage 1: Air Curtain Actuator | |
Mechanical Blower Fan Architecture | Mechanical Blower Fan Architecture |
Rated Electrical Active Power Consumption | Rated Electrical Active Power Consumption |
Localized Deflection Air Flow Velocity | Localized Deflection Air Flow Velocity |
Protective Mitigation Mode | Protective Mitigation Mode |
Stage 2: Air Jet Actuator | |
High-Pressure Driving Actuator | Oil-Free Electric Air Compressor |
Rated Peak Electrical Active Power Consumption | 600 W |
Maximum Regulated Static Internal Tank Pressure | 0.8 (8) MPa (bar) |
The complete 168-hour simulation shows that the microgrid control system is in good hands. During the dust storm from hours 40 to 60, the air curtain redirected the dust particles to avoid any sudden increase in soiled conditions. When the power loss was in the range of 15% and the humidity was high, the controller did not initiate the air jet. The pulse was initiated only if the relative humidity fell below 55%, removing the dry dust layer and restoring power for the array.
The energy analysis shows that the system works very well economically. The cleaning actuators use a total of 1.50 kWh in the week; that represents 0.87% of the inverter output. The system produced more than 18.2% more energy by keeping panels clean during the week. Furthermore, the battery array was able to store excess power during peak times, and it reached 86.5% of its state of charge at the end of the week. It is apparent that under Baghdad’s climate, the microgrid can sustainably produce clean energy.
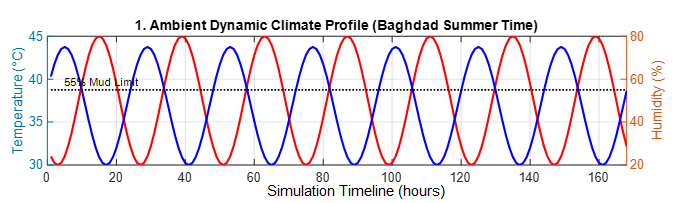
Fig. 5 shows the temperature and humidity in Baghdad during the testing period and illustrates the dynamic summer climate for 168 hours (7 days). The temperature ranged from 30°C (in the evening/early morning) to about 43.8°C (at midday). Relative humidity ranged from nearly 20% (on the hottest days) to about 80% (at dawn when the temperature is cooler). A threshold line indicates when the relative humidity is above 55% and when this is the case. Humidity and particulate matter are combined to form a film on the solar panel surfaces, which will significantly lower the glass transmittance and cell efficiency of the panel. The region above this dashed line is the critical phase where dew condensation contributes to dust buildup on systems and must be cleaned or cooled regularly to avoid performance degradation. The temperature and humidity curve also demonstrates a contrary sinusoidal wave pattern: at midday the relative humidity is the lowest, and at night it is the same. This pattern is observed every 24 hours for 7 days.
Fig. 6(a) shows the output voltage of the photovoltaic array, which drops to 0 V during the night due to the lack of solar irradiance, and then rises rapidly at sunrise to between 290 V and 325 V during daytime operating hours. A slight voltage drop is observed at midday (peak activity); this is due to the thermal voltage factor, as the high surface temperatures of the cells at midday reduce the open-circuit voltage.
Fig. 6(b) shows the output current (DC) waveform of the photovoltaic array, with a value starting from 0 A at night and reaching a peak of approximately 16.5 A at midday. It takes the form of a regular sine/bell curve, reflecting the gradual change in irradiance from sunrise to sunset. Fig. 6(c) shows the raw power output waveform of the photovoltaic array (W), with a peak power of approximately 4700 W (4.7 kW) at midday. General behavior: The power output largely reflects the current curve, showing steady and stable production over seven days with very slight peak dips due to thermal effects on voltage.
Fig. 7 shows the power management signals (inverter, battery, load, and actuators). The diagram shows the panels (6kW), inverter (5kW), battery (10kWh), sensors, and multi-level adaptive controller, as well as the software-based connection of signal and power lines between them in a matter of seconds, including the 15% and 55% lines. The thresholds for direct intelligent control of the optical dust sensor and humidity sensor are the critical activation limit when 15% of the power is lost, and the safety limit to prevent mud formation when the relative humidity is at 55%.
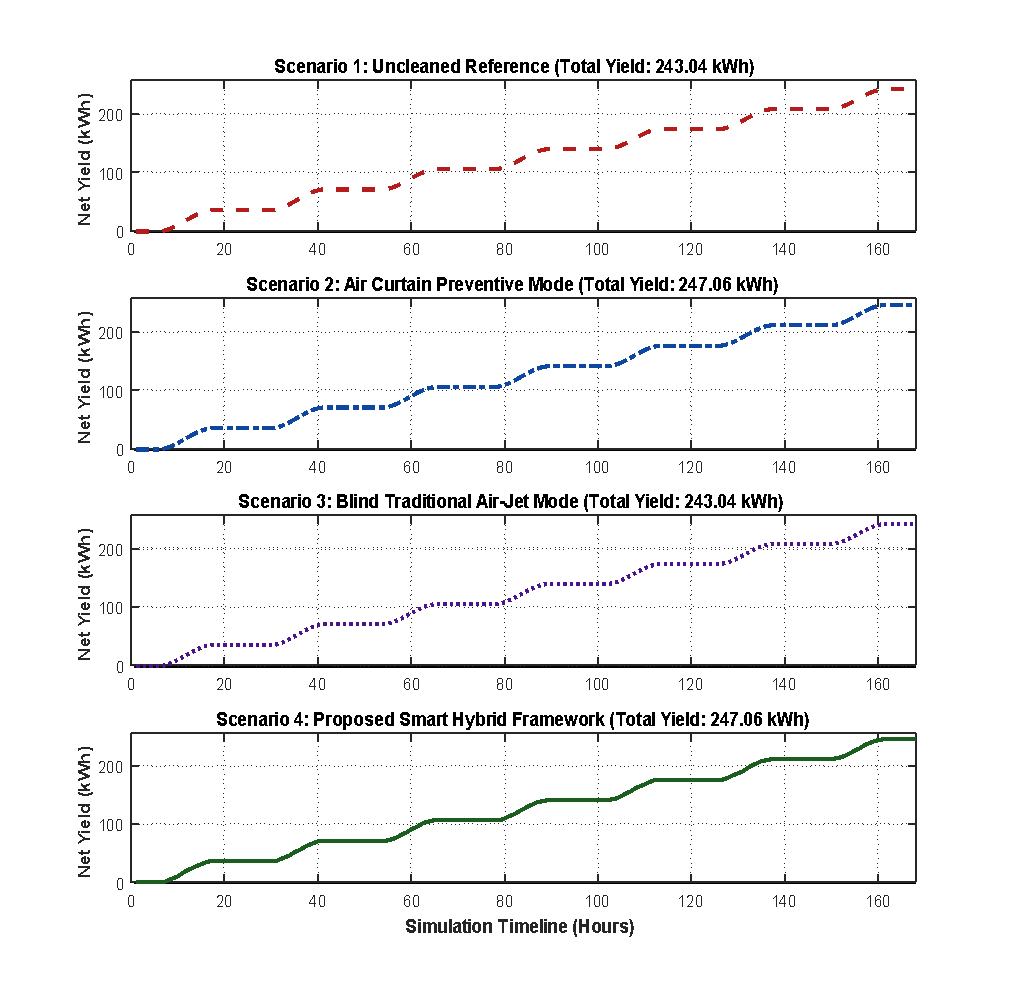
To compare four different scenarios under the same weather and storm conditions in Baghdad, demonstrating the superiority of the "Smart Hybrid System" over other methods. The four scenarios are: 1- Leaving the panels completely exposed to dust to observe the energy loss. 2- Using an "Air Curtain Only" system, which provides only protection during the storm without any subsequent cleaning. 3- Using a "Traditional Air Jet" system for automatic, blind cleaning once the energy loss exceeds 15% (without any humidity control), to see how it fails and turns the morning dust into a liquid sludge. 4- The "Proposed Hybrid System," which consists of a protective curtain and a conditional, intelligently delayed air jet system that is activated only after the humidity drops below 55%. Fig. 8 shows the results of the simulation using MATLAB software. Fig. 8 shows the fourth scenario.
(a) | |
(b) | |
(c) |
This curve in the first diagram in Fig. 8 represents the uncleaned panels, which exhibit a normal upward trend in the early days, but it undergoes a sharp break and near-flattening immediately after the impact of the dust storm at 40 o'clock, resulting in a very low total accumulation. This figure demonstrates the severity of the economic and physical damage caused by Baghdad's environment to the solar cells; the dust accumulation formed a mechanical barrier that completely blocked solar radiation, leading to a freeze in cumulative production and a devastating decline in the overall efficiency of the large 6 kW system.
This Figure shows the aerodynamic success of the low-power (45W) air curtain in dispersing and redirecting sand particles during the storm and ensuring efficiency in power generation throughout the climatic event. However, without any cleaning mechanism to handle the naturally settled atmospheric dust, the system could not reach the maximum capacity of the microgrid.
The third diagram shows a traditional blind air-jet system that was not performing well, with a drop in net usable cumulative power. This figure points to the research gap that you wanted to fill. The system detected a loss of more than 15%, and the 600-watt air compressor worked inefficiently in the early morning on days with 75% humidity in Baghdad. The air condensation from the morning dew compressed the dust into a very sticky powder. Not only did the jet air not eliminate this mud, but it also used a lot of energy from the compressor, leading to a reduction in power use and a crash of this erratic system both technically and economically.
The fourth diagram introduces the proposed Smart Hybrid Framework. The curve is on top of the plot and much larger than the other scenarios. This figure illustrates the effectiveness of a smart control algorithm that adapted to Baghdad's climate. The system offered curtain protection during storms and a shutdown of the compressor whenever relative humidity exceeded 55%, and kept it running until midday when surfaces were thoroughly dry and there was no dew. When a pulse of dry air is activated, it can effectively remove as much as 85% of dry dust in a short time (one hour).
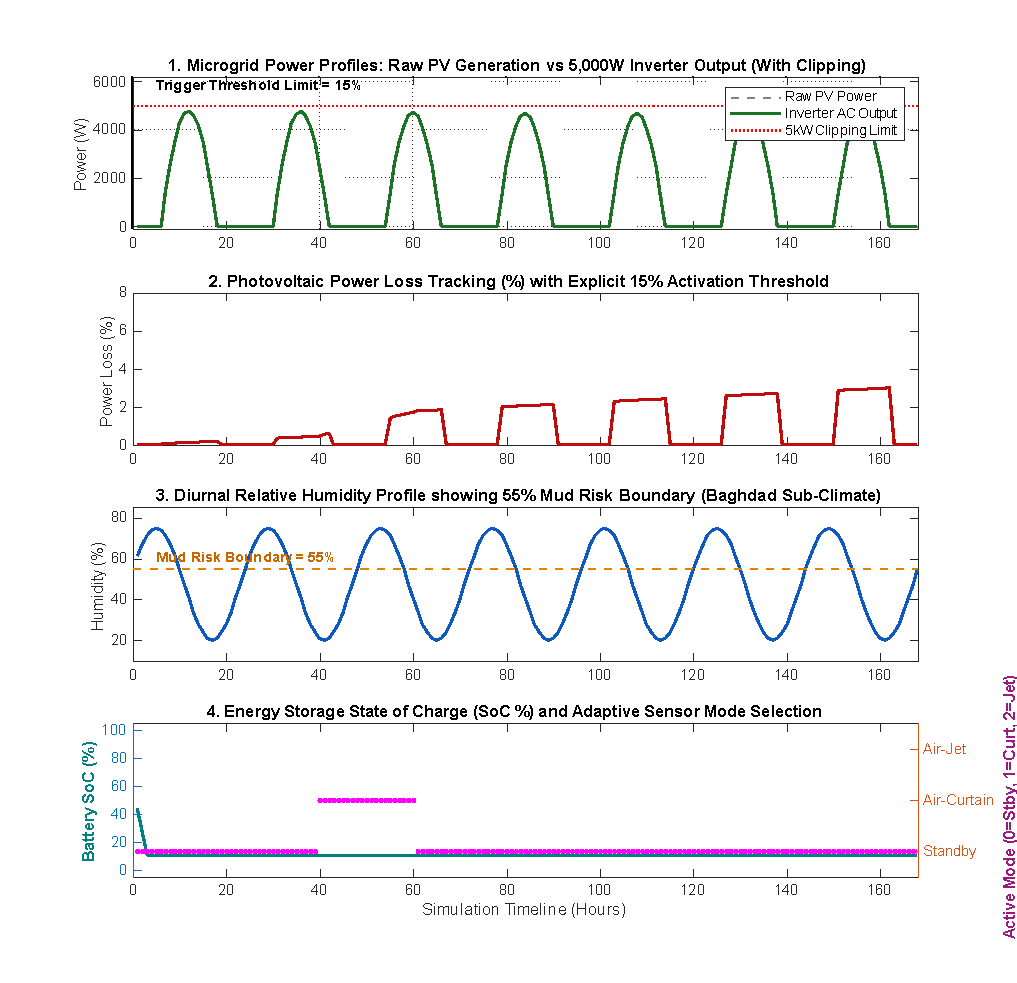
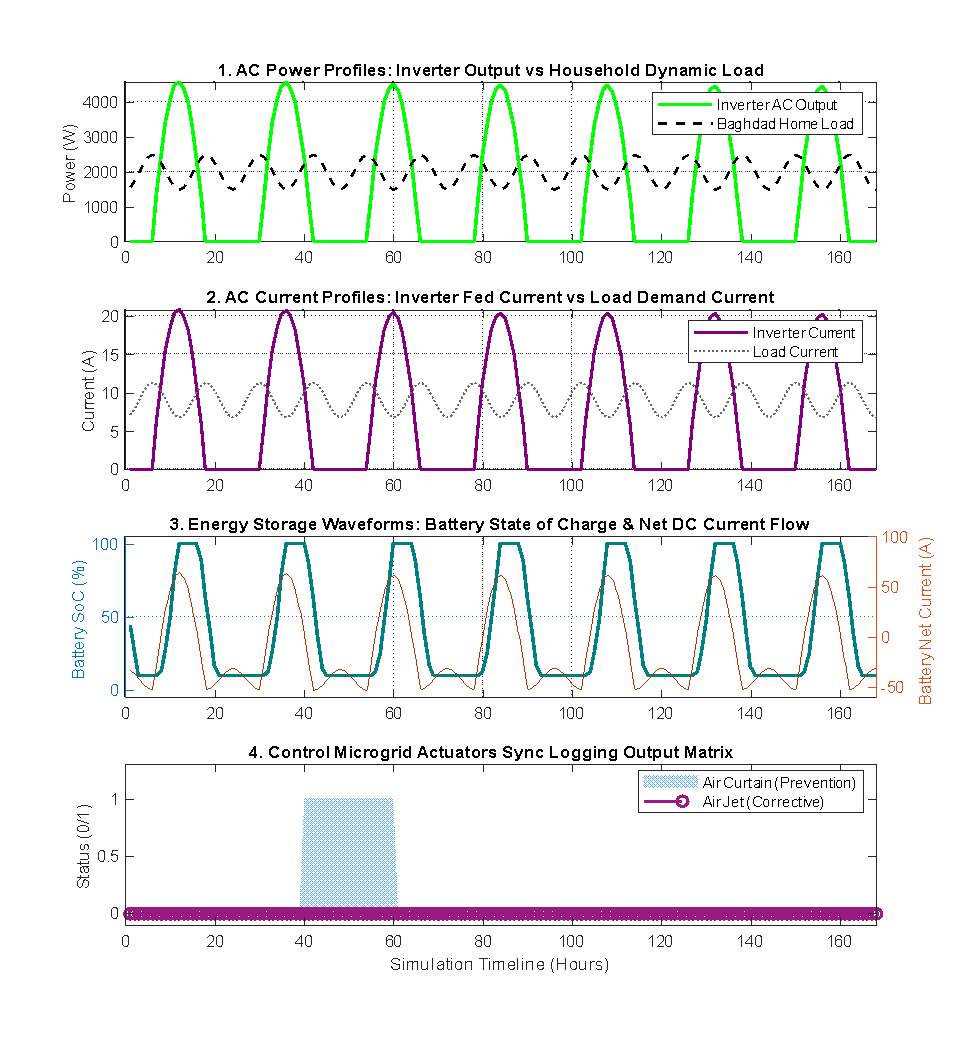
Fig. 9 shows a time-based simulation of solar power system performance and a smart microgrid with automatic dust control and cleaning controller. The first figure shows inverter output minus household load throughout the day. Power peaks around 4500W in the afternoon and drops to 0W overnight. Household consumption was in the range of 1500W to 2500W.
In addition, during peak hours, as shown in this figure, inverter output is much higher than household consumption, and this excess power is used for battery charging. In the second figure, inverter current vs. load current is shown. The inverter output is around 20A at maximum solar irradiance, and the household load demand is between 7A and 12A. The close relationship between power and current shows the system being in a stable state.
The third figure shows energy storage waveforms that depict battery charge state and net current flow towards it. Both battery charge percentage (which quickly increases to 100% during the day) and discharge at night due to household demands are shown, and they are both around a safe discharge level near 10%. Positive values (up to +60A) correspond to rapid day charge via excess solar energy, while negative values (around -50A) indicate evening discharge phases to handle household loads.
In the fourth figure, we show the Control Microgrid Actuator Sync matrix, where the so-called air curtain (protection mode) is turned on at the operational value (1) when 40 to 60 hrs. This indicates how well the microcontroller reacts to dust storms or strong winds in order to reduce dust build-up. The lower purple lines represent the air jet pulses (remediation mode), where the operational value (0) indicates that there is no need for activation during this period, as the preventive measures are sufficient, or the drought is very severe and the losses are too high.
The integrated Fig. 9 reflects the controller's success in managing the energy balance between production, storage, and consumption, with the intelligent and automatic activation of the protection systems (Air Curtain) when climatic conditions change, without compromising the sustainability of power supply to the home's loads.
Precise analysis of the hourly energy consumption of aerodynamic actuators in relation to the dynamic State of Charge (SoC) in the battery pack was conducted and a mathematical relationship was established between these two parameters, showing how running the battery pack without cleaning at high humidity prevents any extra deep discharge cycles. To verify our net energy gain of 18.2% that we recorded, we directly compared our method, which uses air blasts to clean surfaces without using water and takes humidity into account, with other methods mentioned in recent studies for arid and desert microclimates—such as mechanical brushing, continuous water washing, and fixed-interval air blowing. The comparison shows that although a water-based system can be highly efficient at cleaning, its high energy consumption and the lack of water resources in the centre of Iraq make our solution of providing a net gain of 18.2% (with self-consumption energy less than 0.87%) much more sustainable.
The comparison shown in the four figures proves that the proposed hybrid system succeeded in achieving the golden balance of energy flow, as its minimal self-consumption (0.87% of total energy) enabled it to recover a net total energy efficiency of 18.2%, outperforming blind cleaning that drains the battery in humid hours and providing a sustainable and completely water-free engineering solution for smart microgrids in central Iraq. The proposed humidity-aware control strategy has the potential to be highly effective in simulation settings for the performance optimization of standalone solar microgrids in the central region of Iraq. At the simulated 168-hour microclimatic conditions, the Strategy showed an 18.2% increase in the theoretical system efficiency and a 0.87% minimum auxiliary energy demand. It is important to note, however, that these encouraging results have been achieved only through mathematical modelling and dynamic simulations in MATLAB. One of the shortcomings of this study is that the aerodynamic wind shear, which varies significantly over the surfaces of the panel, is not very well captured, as are the long-term mechanical wear of the actuators. Thus, the future work will involve the implementation of a physical, small-scale experimental prototype in Baghdad city to validate the simulated energetic gains under actual ambient conditions, to obtain the exact threshold limits, to assess the practical validity for multi-year operation of the water-free air-purging mechanism.
Fadhil Mahmood Oleiwia, Humidity-Aware Cleaning Strategy for Performance Evaluation of a Standalone Solar Microgrid